I really didn't understand at what point @unizen_io gave up on the project!
The team behind $ZCX had enough skill to take this project very high; it's a shame to see such a good idea slowly dying! https://t.co/hlp32L68DT


 16.0K @ualifiaraujo
 I really didn't understand at what point @unizen_io gave up on the project!
The team behind $ZCX had enough skill to take this project very high; it's a shame to see such a good idea slowly dying! https://t.co/hlp32L68DT
16.0K @ualifiaraujo The market should make sure that you are never involved in any new crypto project.
@seannogazen @MartinGranstrom @MattzBuilds
 10
10
 4
4
 1.6K
16.0K @ualifiaraujo
1.6K
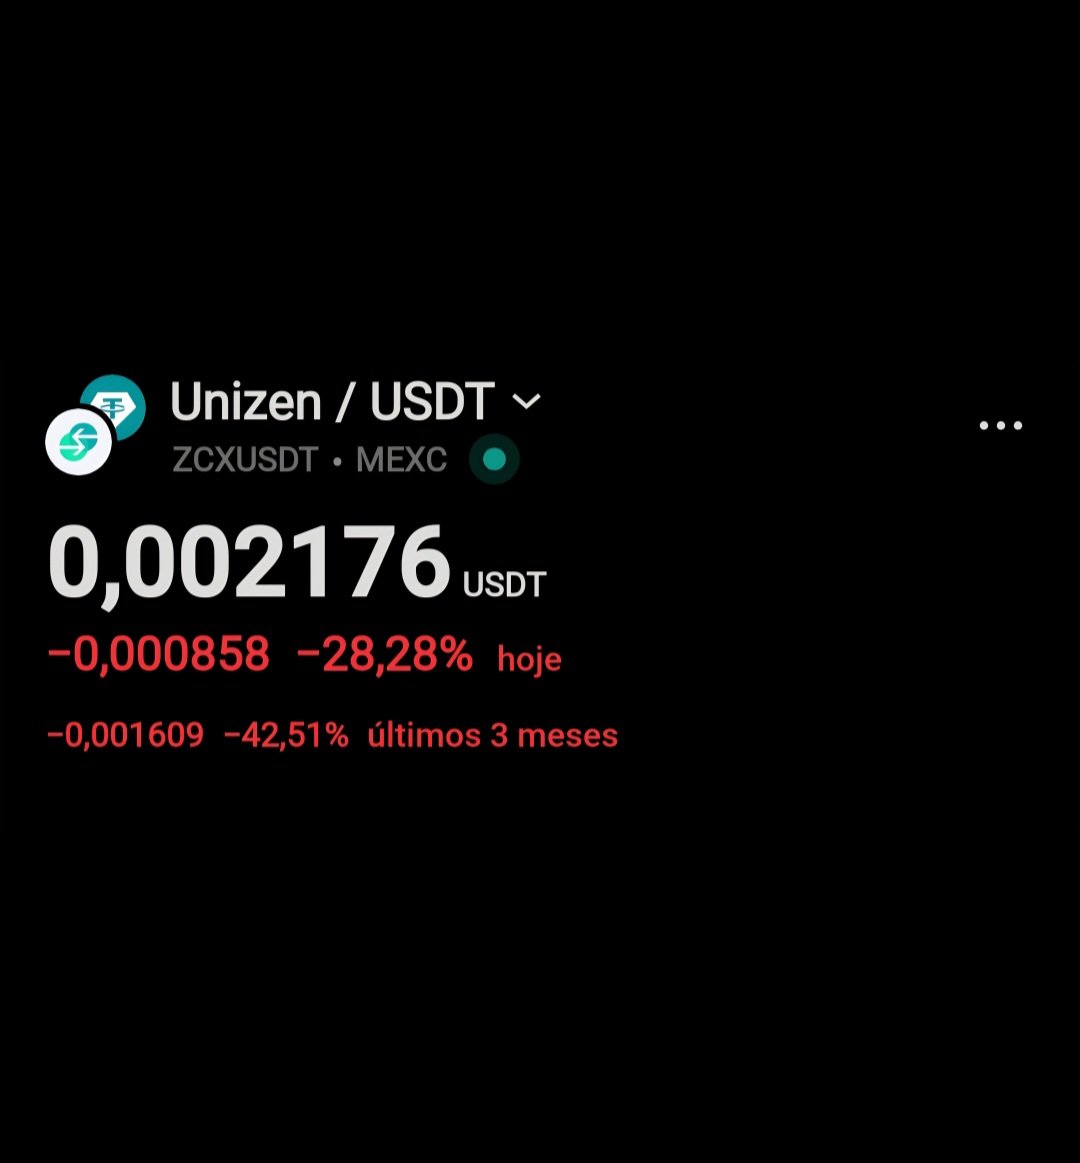
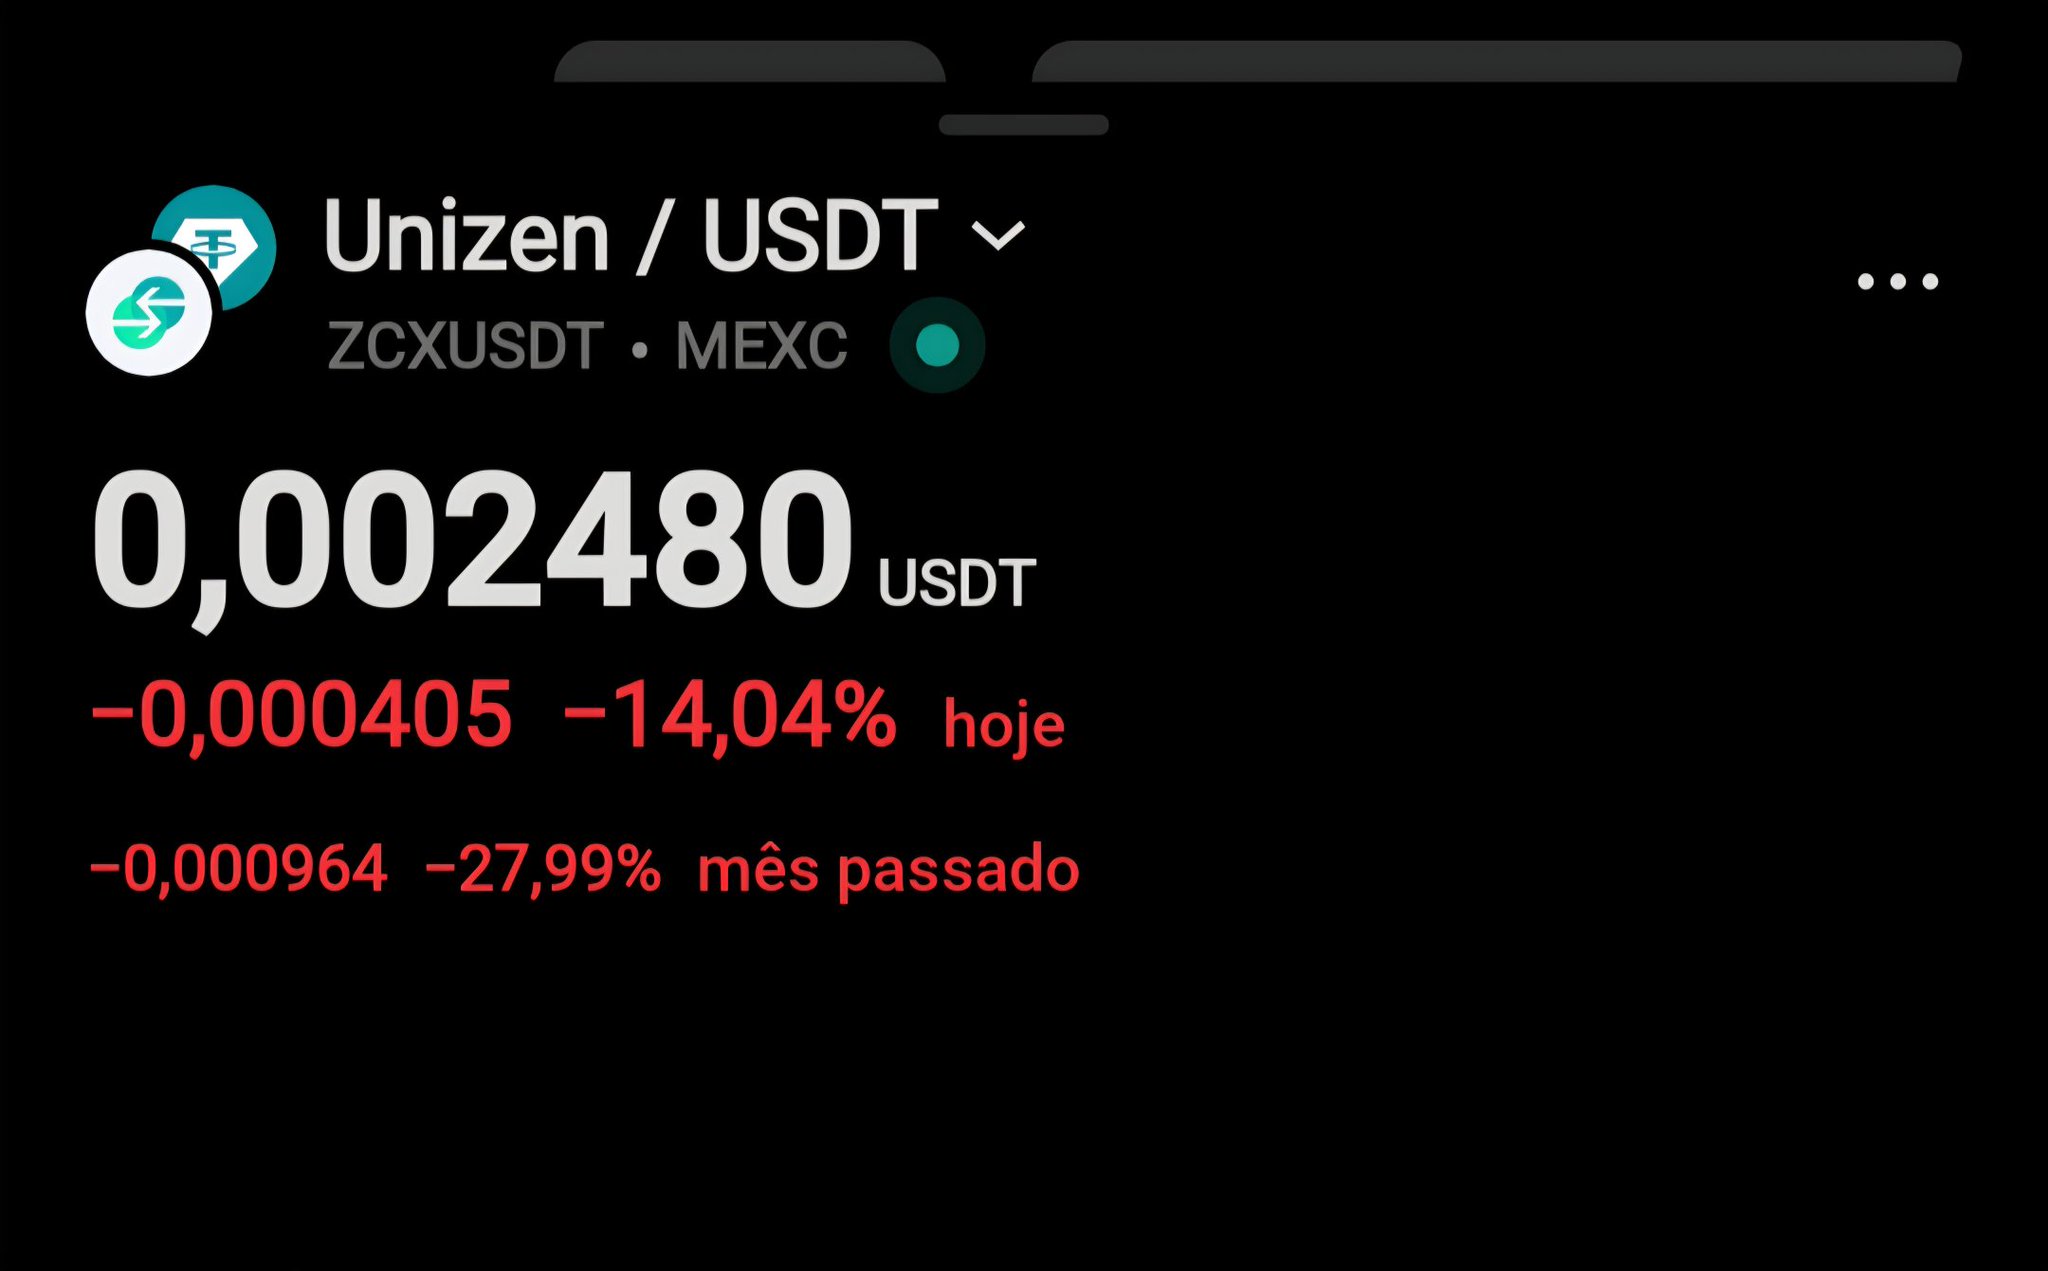
16.0K @ualifiaraujo It's unbelievable the downward spiral @unizen_io has suffered.
A seemingly solid project, with an experienced team that's been around for years, and yet we're seeing it not only renewing minimums but also being delisted from @Gate, which is regrettable.
Even @MartinGranstrom, who was always updating on the project, is now "quiet."
Let's not even talk about @seannogazen, who's practically been left behind in 2025.
Or maybe some of the people on the $ZCX team or their advisors can clarify if there will still be a ZCX.
Anyone willing to answer? Is there anything left in this project? @Sim_Berglund @gverdian @OfMiklos @ericzoo
 57.3K @unizen_io
 🧵 BiP Update – Engineering Progress
Here’s what the team has been working on lately 👇
13
2
739
 25.0K @Michael_EWpro
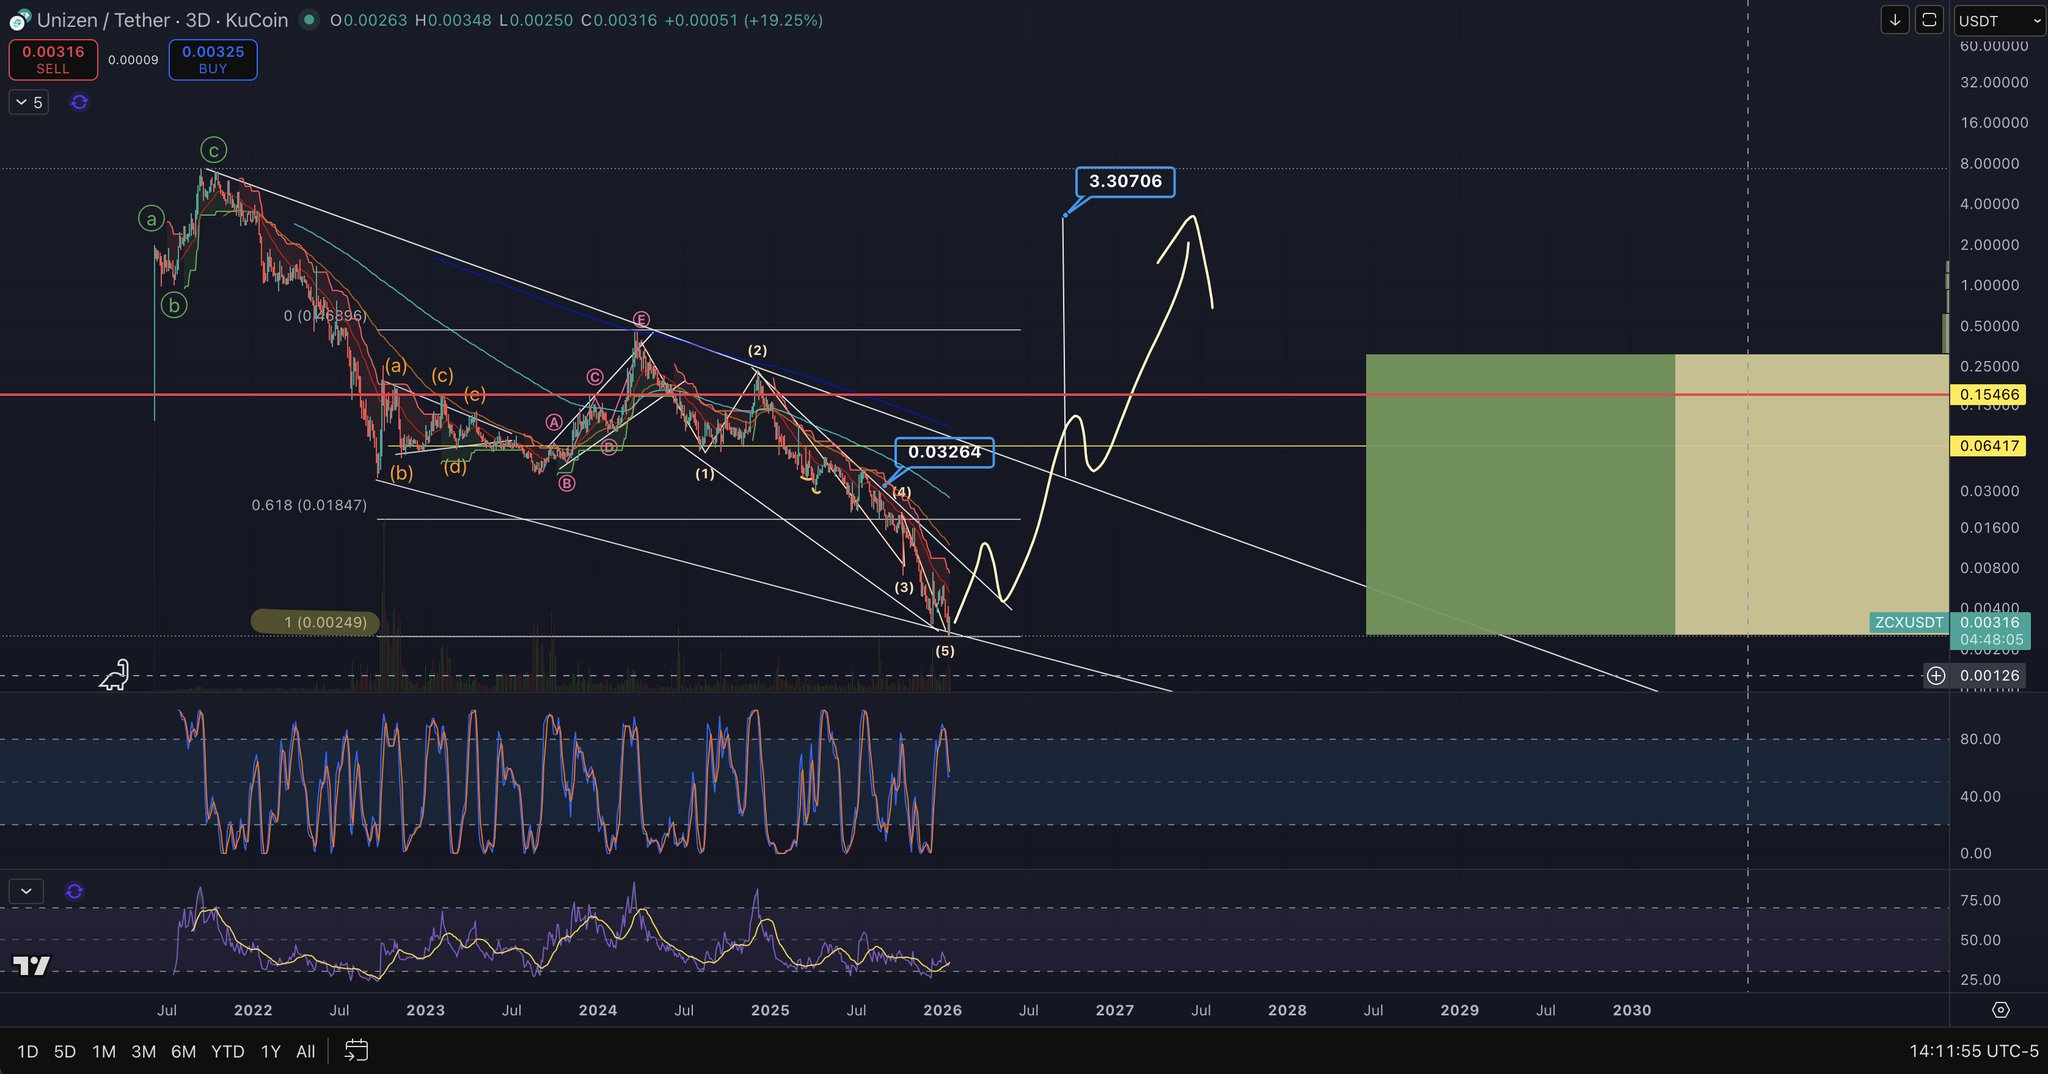
 $ZCX
This coin seems bottomless I still hold a small bag since 2023 and have just held through.
Right now the fib 1 to 1 is being tested and this would be a reasonable spot to consider the bottoms in.
Only issue is I can't make a defined W4 vs the (2) so this could also be w4 and we are still missing one wave down to complete (5).
 16
6
2.2K
16
6
2.2K