شراء العملات المشفرة
بطاقة
تداول P2P
اشتر USDT عبر السوق
بطاقة الائتمان/الخصم
اشترِ العملات المشفرة باستخدام Visa أو Mastercard
الدفع من جهة خارجية
اشترِ العملات المشفرة عبر MoonPay و Simplex والمزيد
بطاقة بيتمارت
تعزيز قدرات حياتك في مجال العملات المشفرة
بطاقة مسبقة الدفع للعملات المشفرة
احصل على بطاقة ماستركارد صالحة للاستخدام فورًا
Rewards
السحب اليومي للحسابات الآجلة
فرصة ربح مضمونة بنسبة 100% مع التداولات اليومية
السحب اليومي لحساب فوري
اكسب 8888 USDT في الجوائز الكبرى
شحن رصيد الهاتف المحمول
شحن الرصيد بسهولة، عبر الإنترنت، وبأمان
Send
Send money globally, fast and secure
BitMart Mall
بث مباشر للعملات المشفرة

Peezy 0x69 (PEEZY)
$ 0.00000041 (PEEZY/USD)
8.26%
24H
Peezy 0x69 بيانات الأسعار المباشرة
سعر اليوم لـ Peezy 0x69 هو $ 0.00000041 (PEEZY/USD). بقيمة سوقية تبلغ $ 128.14K USD. حجم التداول خلال 24 ساعة لـ $ 3,345.24 USD، تغير السعر خلال 24 ساعة بمقدار +8.26%، وإمداد متداول قدره 305.65B PEEZY.
Peezy 0x69 PEEZY سجل الأسعار USD
تتبع سعر Peezy 0x69 لليوم، و7 أيام، و30 يومًا، و90 يومًا
الفترة
تغير
التغير (%)
اليوم
$ 0.000000031
8.26%
7أيام
$ 0.00000011
-22.91%
30أيام
$ 0.00000028
-41.81%
90أيام
$ 0.000000069
21.34%
امتلك PEEZY الآن
اشترِ وبع PEEZY بسهولة وأمان على BitMart.
Peezy 0x69 معلومات السوق
$ 0.00000038 مدى 24سا $ 0.00000042
أعلى مستوى على الإطلاق
$ 0.00000094
أدنى مستوى على الإطلاق
$ 0.00000018
تغير24سا
8.26%
حجم 24سا
$ 3,345.24
الإمداد المتداول
305.65B
PEEZY
القيمة السوقية
$ 128.14K
الحد الأقصى للإمداد
420.69B
PEEZY
القيمة السوقية المخففة بالكامل
$ 176.37K
التداول PEEZY

Peezy 0x69 رؤى X

davie satoshi
TA_Analyst
NFT_Expert
B
 27.3K @NFTdavie
 صاعد
PEEZY technical analysis shows two paths: bullish if support holds, bearish if it breaks.
davie satoshi
TA_Analyst
NFT_Expert
B
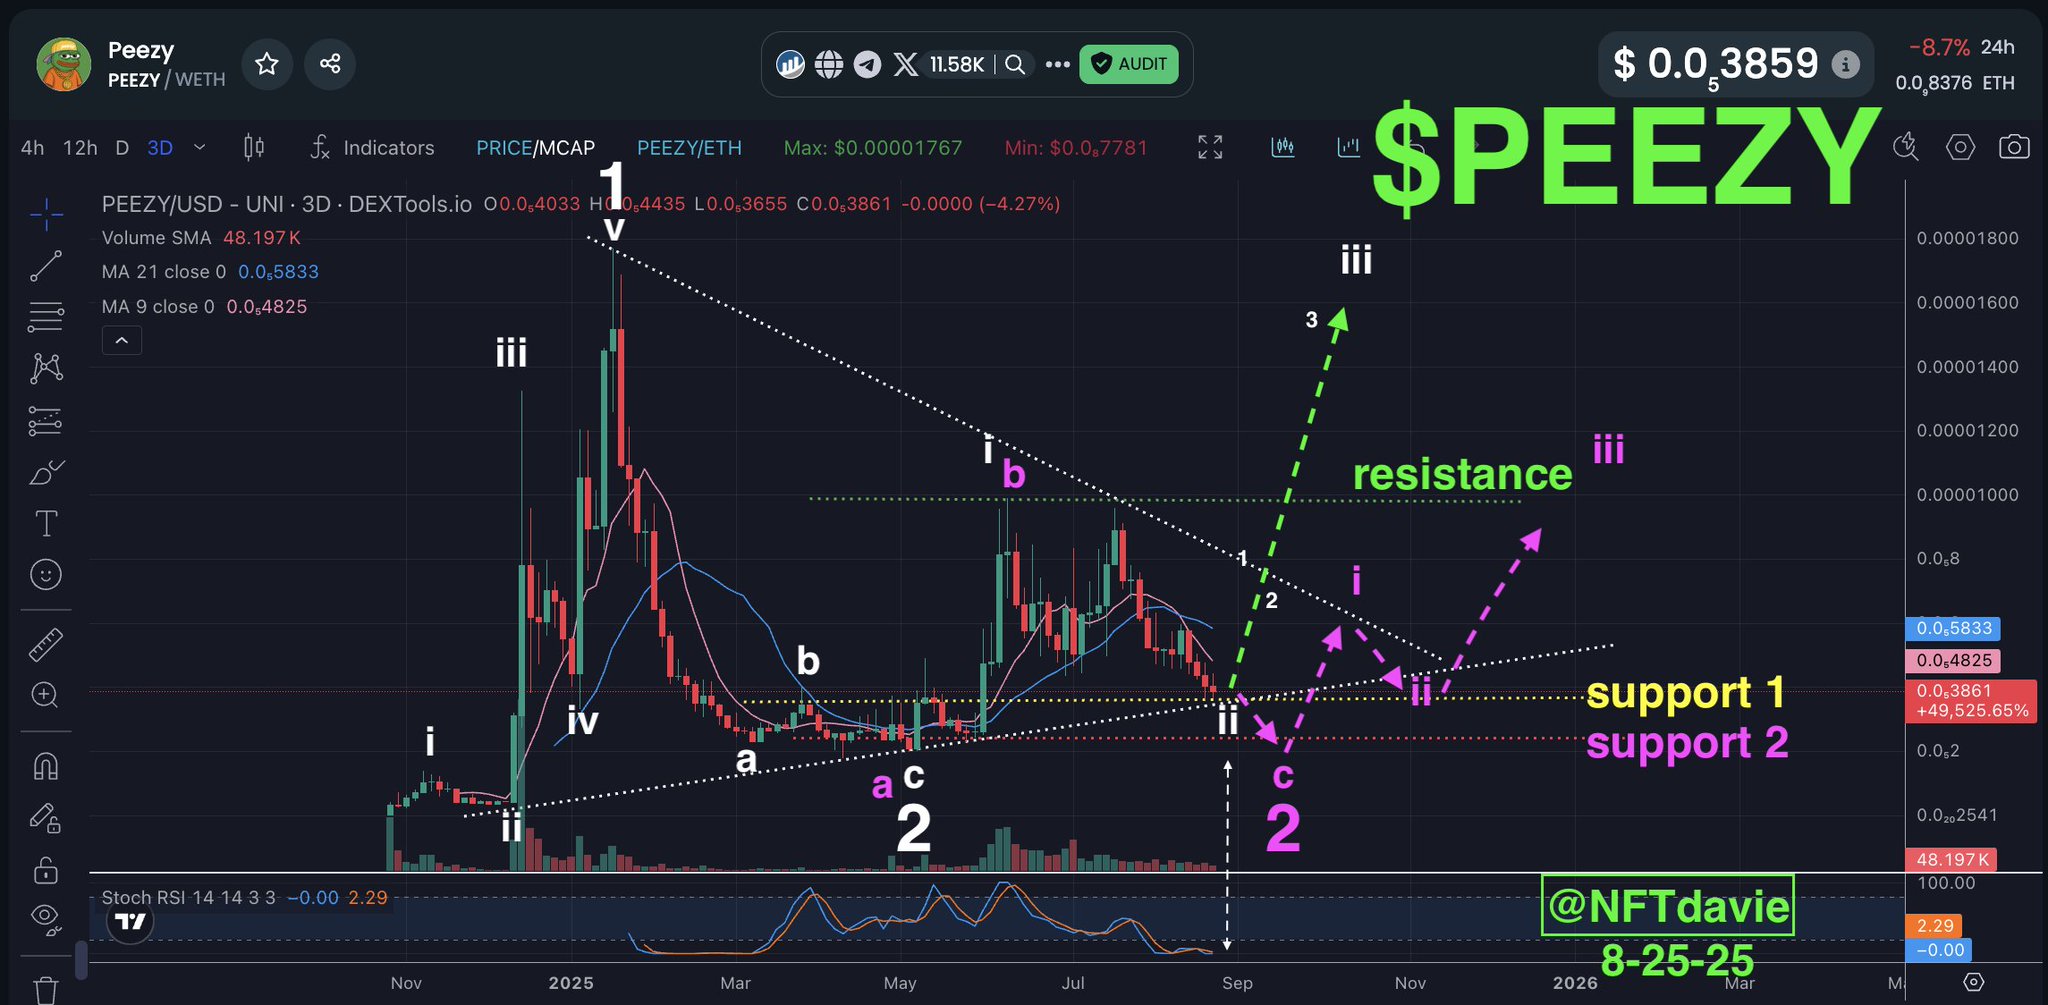
27.3K @NFTdavie Rapid Fire Charts: $PEEZY
PEEZY has many possible routes but here are the two likely routes IMO.
Bullish - GREEN/WHITE - In this scenario, major wave 2 has completed in spring of 2025 and the subsequent waves afterwards are part of major wave 3. We can make out a subwave i of 3 (labeled white i) and wave ii of 3 looks about complete (white ii where we are currently). There are two major support lines here (yellow/white) intersecting which should be strong. That should lead to a bounce here and the beginning of wave iii of 3.
Bearish - PINK - In this scenario, major wave 2 has not completed and $PEEZY is a laggard in the altcoin/memecoin trend. If it falls below the two intersecting support line (yellow and white), then it will fall onto the next one (pink). This does correspond better with the historic low stoch RSI reading on the 3 day chart as the low readings tend to correlate to major wave 2's. In this scenario, the climb back up begins with sub wave i and so forth. This scenario paints a picture of th
 42
42
 13
13
 2.8K
2.8K
2025-08-28 19:24
اتجاه PEEZY بعد الإصدار
صاعد
PEEZY technical analysis shows two paths: bullish if support holds, bearish if it breaks.

Jools
Dev
Influencer
B
20.1K @jewelsindefi صاعد
Predicting that ETH's rise will lead to buying interest for PEEZY.
When $ETH goes crazy, long standing communities like $PEEZY will eventually catch a bid.
Peezy money.
39
7
1.4K
2025-08-28 13:13
اتجاه PEEZY بعد الإصدار
صاعد
Predicting that ETH's rise will lead to buying interest for PEEZY.
davie satoshi
TA_Analyst
NFT_Expert
B
27.3K @NFTdavie محايد
PEEZY technical analysis shows two paths: bullish if support holds, bearish if it breaks.
Rapid Fire Charts: $PEEZY
PEEZY has many possible routes but here are the two likely routes IMO.
Bullish - GREEN/WHITE - In this scenario, major wave 2 has completed in spring of 2025 and the subsequent waves afterwards are part of major wave 3. We can make out a subwave i of 3 (labeled white i) and wave ii of 3 looks about complete (white ii where we are currently). There are two major support lines here (yellow/white) intersecting which should be strong. That should lead to a bounce here and the beginning of wave iii of 3.
Bearish - PINK - In this scenario, major wave 2 has not completed and $PEEZY is a laggard in the altcoin/memecoin trend. If it falls below the two intersecting support line (yellow and white), then it will fall onto the next one (pink). This does correspond better with the historic low stoch RSI reading on the 3 day chart as the low readings tend to correlate to major wave 2's. In this scenario, the climb back up begins with sub wave i and so forth. This scenario paints a picture of th
42
13
2.8K
2025-08-25 16:15
اتجاه PEEZY بعد الإصدار
محايد
PEEZY technical analysis shows two paths: bullish if support holds, bearish if it breaks.
توقع السعر
متى يكون الوقت المناسب لشراء PEEZY؟ هل يجب أن أشتري PEEZY أو أبيعه الآن؟
عند اتخاذ قرار ما إذا كان الوقت مناسبًا للشراء أو البيع Peezy 0x69 (PEEZY)، من المهم أولاً أن تتوافق مع إستراتيجيتك الخاصة في التداول وملف المخاطر الخاص بك. غالبًا ما يفسر المستثمرون على المدى الطويل والمتداولون على المدى القصير ظروف السوق بشكل مختلف، لذا يجب أن يعكس قرارك نهجك الشخصي. استنادًا إلى أحدث تحليل تقني لمدة 4 ساعات لـ PEEZY، فإن إشارة التداول الحالية هي بيع. وفقًا لأحدث تحليل تقني لـ PEEZY لمدة يوم واحد، فإن الإشارة الحالية هي شراء.

توقعات Beacon
توقعات الأسعار الاحتمالية (الـ 24 ساعة القادمة)إخلاء مسؤولية توقعات Beacon
يتم تحليل نتائج البيانات المعروضة في هذه الصفحة استنادًا إلى بيانات التداول الفعلية (OHLCV) لزوج التداول المحدد إلى جانب المؤشرات التقنية المقابلة.
هذا التنبؤ هو منتج تقني تجريبي ويتم توفيره لأغراض مرجعية فقط. ولا يشكل نصيحة استثمارية. قد تؤثر الأحداث غير المتوقعة في العالم الحقيقي بشكل كبير في سلوك السوق. يجب على المتداولين اتخاذ القرارات بحذر.
هذا التنبؤ هو منتج تقني تجريبي ويتم توفيره لأغراض مرجعية فقط. ولا يشكل نصيحة استثمارية. قد تؤثر الأحداث غير المتوقعة في العالم الحقيقي بشكل كبير في سلوك السوق. يجب على المتداولين اتخاذ القرارات بحذر.
حول Peezy 0x69
Peezy 0x69 (PEEZY) is a cryptocurrency launched in 2024and operates on the Ethereum platform. Peezy 0x69 has a current supply of 359,709,061,786 with 305,650,329,936 in circulation. The last known price of Peezy 0x69 is 0.00000042 USD and is up 3.95 over the last 24 hours. It is currently trading on 10 active market(s) with $4,363.32 traded over the last 24 hours. More information can be found at https://peezy.vip/.
اقرأ المزيد
الروابط الرسمية
مستكشف السلاسل
اكتشف المزيد.
BM Discovery


إدراج جديد

ZTRA Zentra Privacy
-- 0.00%

GCOIN G COIN
-- 0.00%

ISK$ Iskander Coin
-- 0.00%

$BLAST SafeBLAST
-- 0.00%

SPYON SPDR S&P 500 Tokenized ETF (Ondo)
-- 0.00%

QQQON Invesco QQQ Tokenized ETF (Ondo)
-- 0.00%

MCDON McDonald's Tokenized Stock (Ondo)
-- 0.00%

MSTRON MicroStrategy Tokenized Stock (Ondo)
-- 0.00%

AVGOON Broadcom Tokenized Stock (Ondo)
-- 0.00%

CRCLON Circle Internet Group Tokenized Stock (Ondo)
-- 0.00%