Canaan Inc (CAN) announced that it will acquire a 49% stake in Cipher Mining (CIFR) owned by ABC Projects (Alborz LLC, Bear LLC, Chief Mountain LLC) by issuing 806.4 million Class A common shares (equivalent to 53.8 million American Depositary Receipts). The transaction amount is $39.75 million, and the shares are subject to a six‑month lock‑up period. (CoinDesk)
https://t.co/fLgaYUcy2k
Купить криптовалюту
карта
P2P Трейдинг
Купить USDT через маркетплейс
Кредитная/дебетовая карта
Покупайте криптовалюту с помощью карт Visa или Mastercard
Оплата третьей стороной
Buy Crypto via MoonPay, Simplex and More
Карта BitMart
Расширение ваших криптовозможностей
Предоплаченная криптовалютная карта
Мгновенно получите карту Mastercard, доступную для использования
USDⓈ-M
Использовать USDⓈ в качестве обеспечения
COIN-M
Использовать монету в качестве обеспечения
TradFi
Единый центр торговли металлами, акциями и иностранной валютой
Демо-торговля
Узнайте, как торговать с нулевым риском
Фьючерсная торговля
Универсальная платформа для фьючерсной торговли
Futures King
478,000 USDT Prize Pool
Grow
Обзор программы Earn
Без труда зарабатывайте на незадействованных активах
Сбережения
Зарабатывайте проценты на холдинге
Стейкинг
Простой стейкинг и хорошие вознаграждения
Управление капиталом
Grow Wealth with a Top-Tier Asset Team
RWA
Удерживайте BMRUSD и получайте доход
VIP-эксклюзив
Стабильный заработок для VIP-пользователей
Rewards
Центр вознаграждений
Discover Exclusive Rewards Worth Up to 14,000 USDT
LaunchPrime
Платформа для запуска NFT и токенов
Партнерская программа
Присоединяйтесь к программе, чтобы зарабатывать высокие комиссионные
Powerdrop
Запущено решение для Аирдропов нового поколения!
Центр событий
The One-Stop Hub For All Business Operations
Futures Daily Draw
100% Chance To Win With Daily Trades
Spot Daily Draw
Win 8,888 USDT In Grand Prizes
Участвуйте в стейкинге для голосования
Заработайте эйрдропы, проголосовав
Учреждение
Профессиональные и эксклюзивные сервисы
VIP
Разблокируйте Эксклюзивные Награды
Академия
Быстро изучите трейдинг и блокчейн
BitMart Internship
Start your Crypto Career Here
Bitmart Путешествия
One-Stop Global Travel Services
Mobile Top-Up
Top up mobiles easily, online, secure
Send
Send money globally, fast and secure
BitMart Mall
Live on crypto

Channels (CAN)
$ 0.00023 (CAN/USD)
0.00%
24H
Channels CAN Price History USD
Track the price of Channels for today, 7 days, 30 days and 90 days
Период
Изменить
Изменение (%)
Сегодня
$ 0
0.00%
7дней
$ 0.0000099
4.17%
30дней
$ 0.000019
-7.41%
90дней
$ 0.000019
-7.41%
Own CAN Now
Buy and sell CAN easily and securely on BitMart.
Channels Информация о рынке
$ 0.00023 24 часа $ 0.00024
Рекордный максимум
$ 92.30
Рекордный минимум
$ 0.00012
Изменение за 24 часа
0.00%
Объем за 24 часа
$ 76.93
Количество токенов в обороте
0.00
CAN
Рыночная капитализация
$ 0
Максимальное предложение
1.00B
CAN
Рыночная капитализация при полной эмиссии
$ 239.75K
Торговать CAN
Заработать
Даже незадействованная криптовалюта может приносить пассивный доход! Пользуйтесь сбережениями, услугами стейкинга и другими преимуществами.
Channels Инсайт из X

吴说区块链
Media
Educator
D
 177.6K @wublockchain12
 Нейтрально
Canaan acquires 49% stake in Cipher Mining with the issuance of 806.4 million shares, transaction amount $39.75 million
 1
1
 1
1
 358
358
2026-02-24 11:21
Тренд CAN после выпуска
Нейтрально
Canaan acquires 49% stake in Cipher Mining with the issuance of 806.4 million shares, transaction amount $39.75 million

Ace of Trades
TA_Analyst
Trader
C
14.6K @acethebullly Нейтрально
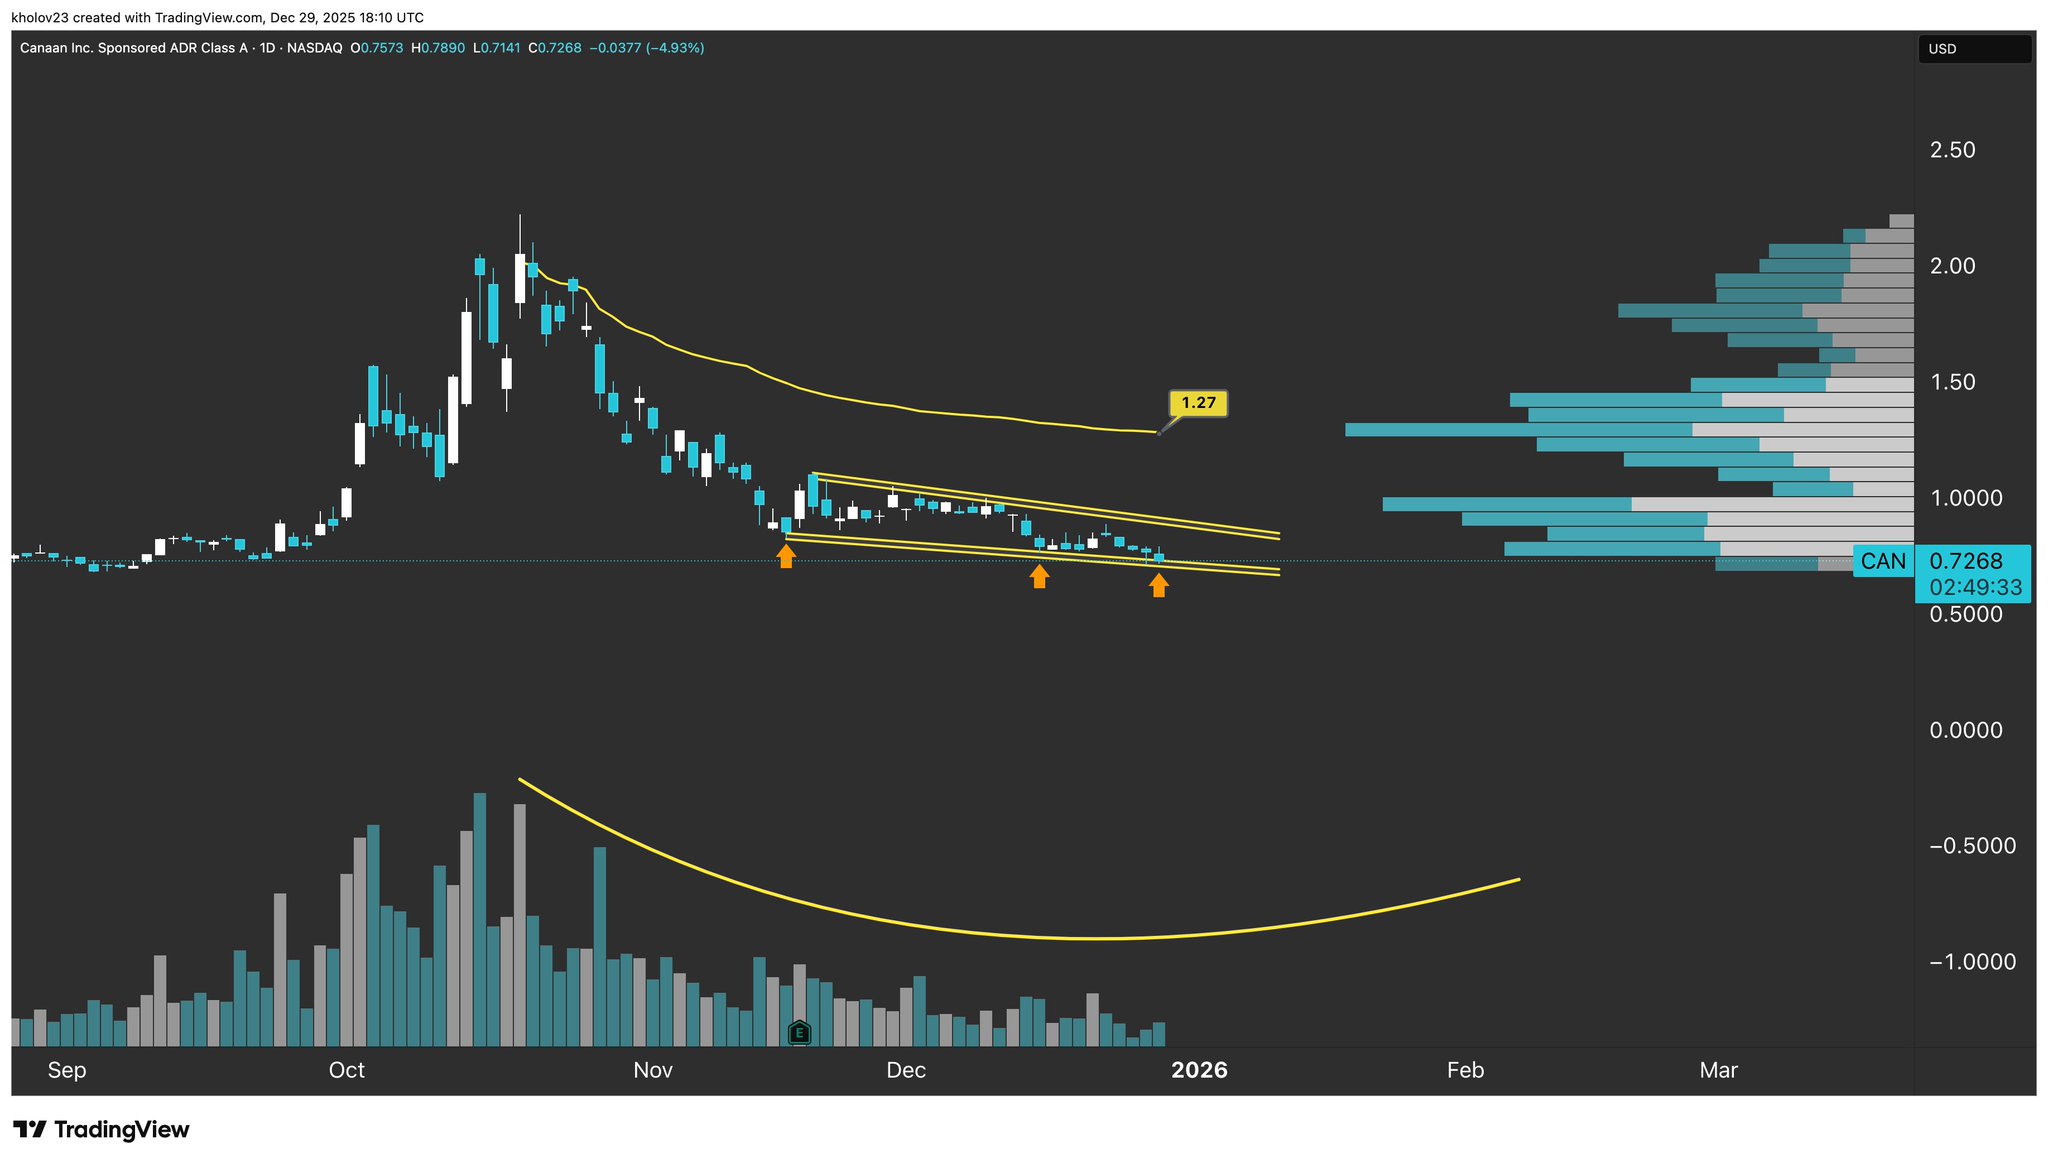
CAN price has touched the descending channel support level for the third time, indicating a potential technical rebound opportunity.
$CAN

Mr Chart Norris D
20.1K @kholov23 $CAN Daily Candle Chart
Thats your THIRD touch
 7
1
2.2K
7
1
2.2K
2025-12-29 23:27
Тренд CAN после выпуска
Нейтрально
CAN price has touched the descending channel support level for the third time, indicating a potential technical rebound opportunity.
Ace of Trades
TA_Analyst
Trader
C
14.6K @acethebullly Бычий
CAN is consolidating in the 0.87‑1.03 range, fundamentals are favorable, and short-term support remains.
Stop crying 😭
This guy just handed all his gains back on a silver platter.
Classic bag holder move 🤣🤣

Ali Hshrof | ₿ D
349 @Ali_hashroof The chart read is incomplete. $CAN isn’t in a “full bearish alignment” — it’s in a low-volume accumulation range.
Price has been moving sideways between $0.87–$1.03, which is classic post-capitulation basing, not institutional selling. Distribution requires surging volume and breakdown candles — none of which are present. The flattening volatility, thin Ichimoku cloud, and neutral OBV all point to absorption, not rejection.
Calling it a downtrend across all timeframes ignores the fundamental catalysts now stacking beneath the chart:
• Frost & Sullivan ranks Canaan #2 globally in ASIC compute power
• Q3 revenue beat expectations with strong YoY growth
• New partnerships: SynVista Energy (green compute + AI load balancing) and SLNH hosting
• Expanding footprint: Canada, Japan, Ethiopia, North America
• Zero meaningful short interest + 106 institutional holders
• Active share-buyback program
• Industry shift toward efficient ASIC compute (AI + BTC heat-reuse + clean-power mining)
These are not the signals of
0
0
360
2025-12-04 21:57
Тренд CAN после выпуска
Бычий
CAN is consolidating in the 0.87‑1.03 range, fundamentals are favorable, and short-term support remains.
Прогнозирование цен
When is a good time to buy CAN? Should I buy or sell CAN now?
When deciding whether it’s a good time to buy or sell Channels (CAN), it’s important to first align with your own trading strategy and risk profile.Long-term investors and short-term traders often interpret market conditions differently, so your decision should reflect your personal approach. According to the latest CAN 4-hour technical analysis, the current trading signal is Продать. According to the latest CAN 1-day technical analysis, the current signal is Hold.

Прогноз Beacon
Probabilistic Price Forecast (Next 24 Hours)Отказ от ответственности за прогноз Beacon
The data results displayed on this page are analyzed based on actual trading data (OHLCV) of the selected trading pair along with corresponding technical indicators.
This prediction is an experimental technical product and is provided for reference purposes only. It does not constitute investment advice. Unexpected real-world events may significantly impact market behavior. Traders should make decisions with caution.
This prediction is an experimental technical product and is provided for reference purposes only. It does not constitute investment advice. Unexpected real-world events may significantly impact market behavior. Traders should make decisions with caution.
О нас Channels
Channels (CAN) is a cryptocurrency launched in 2021and operates on the BNB Smart Chain (BEP20) platform. Channels has a current supply of 1,000,000,000 with 0 in circulation. The last known price of Channels is 0.0002423 USD and is up 2.07 over the last 24 hours. It is currently trading on 20 active market(s) with $0.00 traded over the last 24 hours. More information can be found at https://bsc.channels.finance/.
Читать далее
Официальные ссылки
Chain Explorer
Explore More
BM Discovery


Новые листинги

ATEG ATEG.DV
-- 0.00%

GCOIN G COIN
-- 0.00%

ISK$ Iskander Coin
-- 0.00%

$BLAST SafeBLAST
-- 0.00%

SPYON SPDR S&P 500 Tokenized ETF (Ondo)
-- 0.00%

QQQON Invesco QQQ Tokenized ETF (Ondo)
-- 0.00%

MCDON McDonald's Tokenized Stock (Ondo)
-- 0.00%

MSTRON MicroStrategy Tokenized Stock (Ondo)
-- 0.00%

AVGOON Broadcom Tokenized Stock (Ondo)
-- 0.00%

CRCLON Circle Internet Group Tokenized Stock (Ondo)
-- 0.00%