Rewards
Futures Daily Draw
100% Chance To Win With Daily Trades
Spot Daily Draw
Win 8,888 USDT In Grand Prizes
Mobile Top-Up
Top up mobiles easily, online, secure
Send
Send money globally, fast and secure
BitMart Mall
Live on crypto

AIOZ Network Live Price data
Today's price of AIOZ Network Is $ 0.058 (AIOZ/USD). With A Market Cap Of $ 73.60M USD. 24-Hour Trading Volume Of $ 639.00K USD, A 24-Hour Price Change Of -0.85%, And A Circulating Supply Of 1.26B AIOZ.
AIOZ Network AIOZ Price History USD
Track the price of AIOZ Network for today, 7 days, 30 days and 90 days
Period
Change
Change (%)
Today
$ 0.00049
-0.85%
7days
$ 0.000099
0.17%
30days
$ 0.0094
-13.97%
90days
$ 0.0013
-2.34%
Own AIOZ Now
Buy and sell AIOZ easily and securely on BitMart.
AIOZ Network Market Information
$ 0.057 24h Range $ 0.059
All time high
$ 1.32
All time low
$ 0.047
24h Change
-0.85%
24h Vol
$ 639,001.60
Circulating supply
1.26B
AIOZ
Market cap
$ 73.60M
Max supply
--
Fully diluted market cap
$ 73.60M
Trade AIOZ

AIOZ Network X Insight

Caio Villa - (Cripto Villa)
Educator
DeFi_Expert
B
 25.8K @CriptoVilla
 Bullish
AIOZ launches API interface, supporting batch inference and chained AI, outlook looks promising

AIOZ Network D
104.5K @AIOZNetwork AIOZ AI Major Update: API Access Is Rolling Out
The models you've been running in Playground can now run in your code.
What we shipped:
→ API Keys for solo and team access
→ REST API with one endpoint per model
→ Official SDKs across Python, Node.js, and Go
Now you can:
→ Run inference in batches
→ Wire models into backends
→ Chain AI pipelines
A model you can click is a demo. A model you can call is a building block.
Create a key, make your first call, and start building.
 91
91
 3
3
 1.6K
1.6K
2026-06-10 18:37
Trend of AIOZ after release
Bullish
AIOZ launches API interface, supporting batch inference and chained AI, outlook looks promising

Oz
OnChain_Analyst
TA_Analyst
B
29.8K @AskCryptoWealth Bullish
AIOZ is performing strongly, worth paying attention to, with short-term upward potential
One coin that flies is $aioz..
I am watching this one carefully..
58
8
4.9K
2026-06-08 15:27
Trend of AIOZ after release
Bullish
AIOZ is performing strongly, worth paying attention to, with short-term upward potential

Maelius
TA_Analyst
Trader
A
9.6K @MaeliusCrypto Extremely Bullish
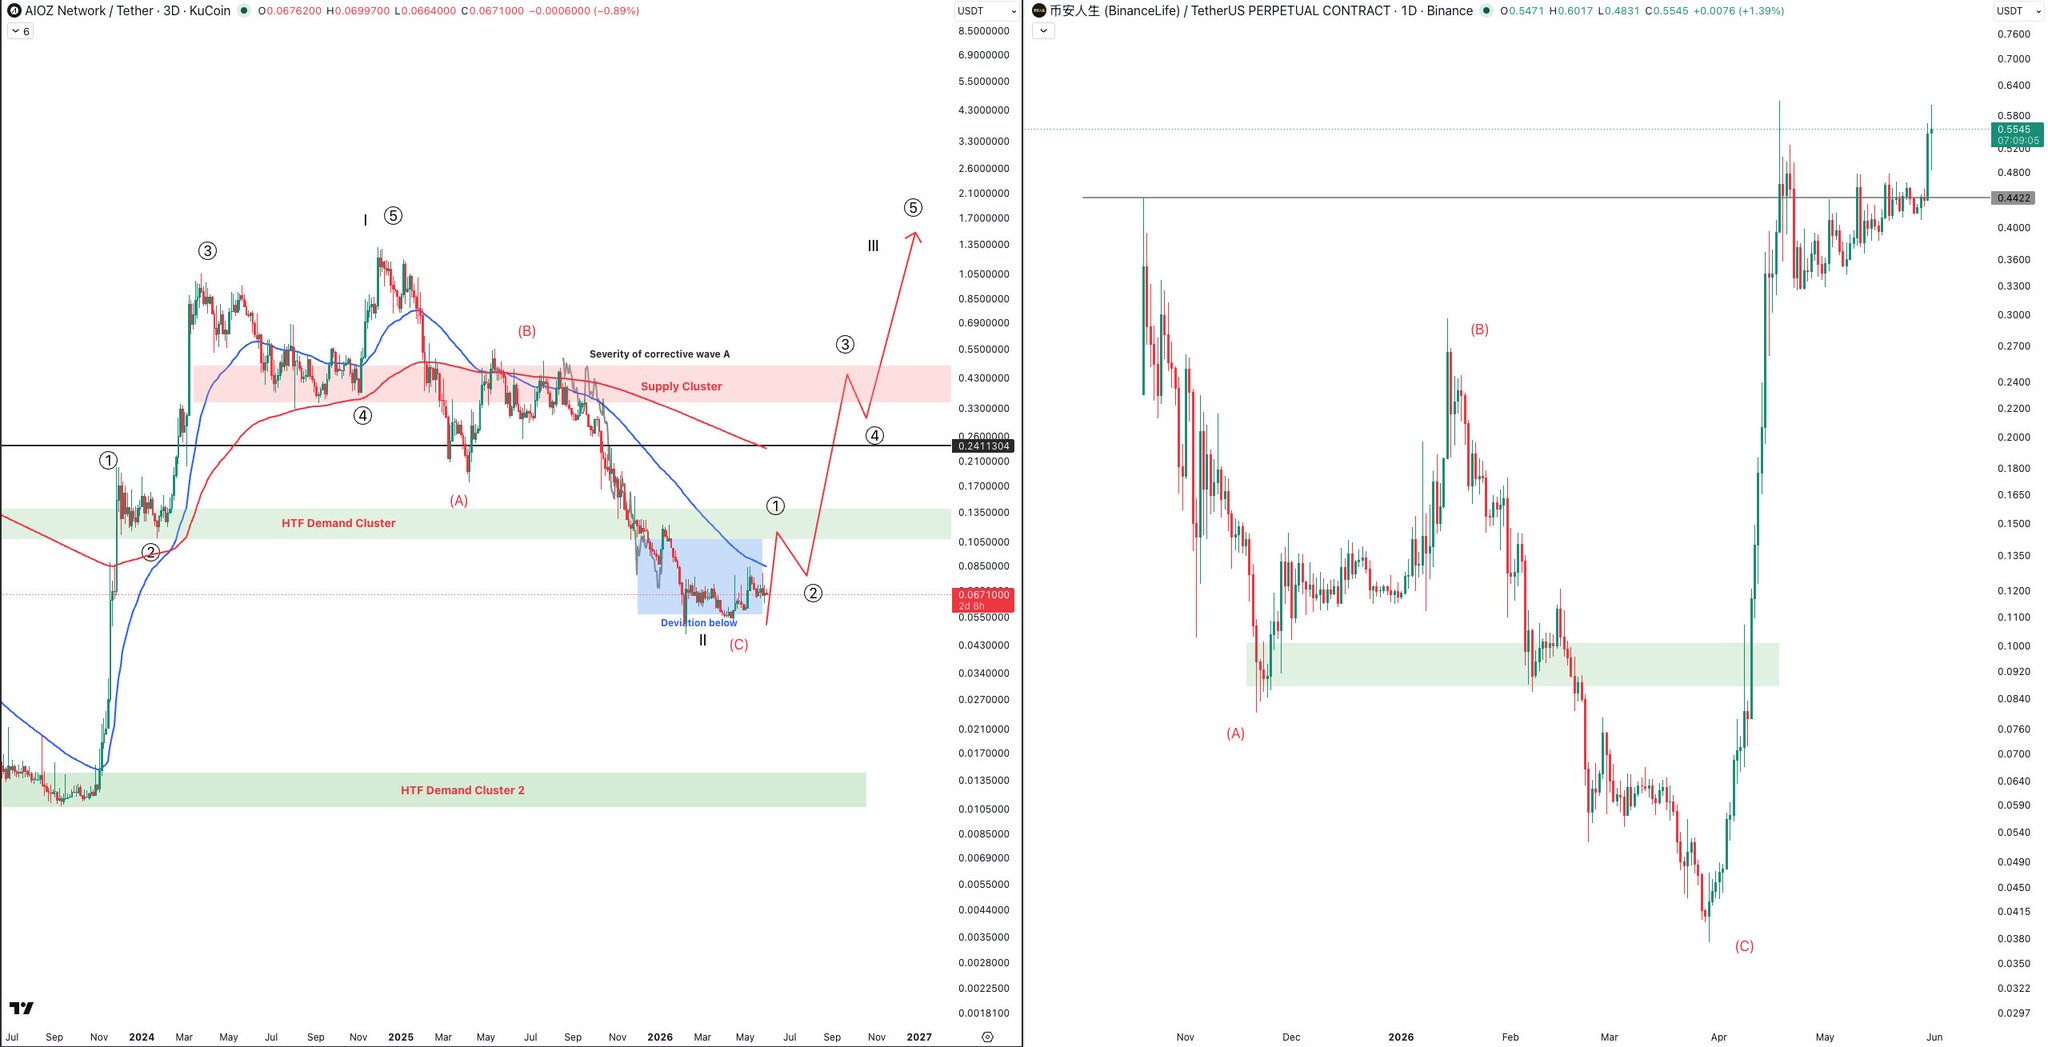
Altcoins are performing strongly, TRACT has surged, AIOZ is gearing up, showing a similar bullish structure.
Maelius
TA_Analyst
Trader
A
9.6K @MaeliusCrypto Just for you to see how $alts can move. 2 similar corrective structures, one skyrocketing off the lows, the other still coiling.
$AIOZ on the left vs. 币安人生 (Binancelife) https://t.co/VOIO6YU9Zt
 49
4
4.2K
49
4
4.2K
2026-06-01 10:37
Trend of AIOZ after release
Extremely Bullish
Altcoins are performing strongly, TRACT has surged, AIOZ is gearing up, showing a similar bullish structure.
Price Prediction
When is a good time to buy AIOZ? Should I buy or sell AIOZ now?
When deciding whether it’s a good time to buy or sell AIOZ Network (AIOZ), it’s important to first align with your own trading strategy and risk profile.Long-term investors and short-term traders often interpret market conditions differently, so your decision should reflect your personal approach. According to the latest AIOZ 4-hour technical analysis, the current trading signal is Hold. According to the latest AIOZ 1-day technical analysis, the current signal is Hold.

Beacon Prediction
Probabilistic Price Forecast (Next 24 Hours)Beacon Prediction Disclaimer
The data results displayed on this page are analyzed based on actual trading data (OHLCV) of the selected trading pair along with corresponding technical indicators.
This prediction is an experimental technical product and is provided for reference purposes only. It does not constitute investment advice. Unexpected real-world events may significantly impact market behavior. Traders should make decisions with caution.
This prediction is an experimental technical product and is provided for reference purposes only. It does not constitute investment advice. Unexpected real-world events may significantly impact market behavior. Traders should make decisions with caution.
About AIOZ Network
AIOZ Network (AIOZ) is a cryptocurrency . AIOZ Network has a current supply of 1,259,681,734.56909153. The last known price of AIOZ Network is 0.05902399 USD and is up 2.28 over the last 24 hours. It is currently trading on 163 active market(s) with $4,458,954.59 traded over the last 24 hours. More information can be found at https://aioz.network/.
Read More


Buy AIOZ
Trade AIOZ