$ZETA is quietly setting up for what could be a very nice move in the coming weeks
Stay ready
Not financial advice
Rewards
Futures Daily Draw
100% Chance To Win With Daily Trades
Spot Daily Draw
Win 8,888 USDT In Grand Prizes
Mobile Top-Up
Top up mobiles easily, online, secure
Send
Send money globally, fast and secure
BitMart Mall
Live on crypto

ZetaChain (ZETA)
$ 0.039 (ZETA/USD)
0.00%
24H
ZetaChain Live Price data
Today's price of ZetaChain Is $ 0.039 (ZETA/USD). With A Market Cap Of $ 58.38M USD. 24-Hour Trading Volume Of $ 3.35M USD, A 24-Hour Price Change Of +0.00%, And A Circulating Supply Of 1.46B ZETA.
ZetaChain ZETA Price History USD
Track the price of ZetaChain for today, 7 days, 30 days and 90 days
Period
Change
Change (%)
Today
$ 0
0.00%
7days
$ 0
0.00%
30days
$ 0.0099
-20.00%
90days
$ 0.0099
-20.00%
Own ZETA Now
Buy and sell ZETA easily and securely on BitMart.
ZetaChain Market Information
$ 0.039 24h Range $ 0.039
All time high
$ 0.099
All time low
$ 0.029
24h Change
0.00%
24h Vol
$ 3,347,384.29
Circulating supply
1.46B
ZETA
Market cap
$ 58.38M
Max supply
2.10B
ZETA
Fully diluted market cap
$ 83.90M
Trade ZETA
ZetaChain X Insight

StockChaser
TA_Analyst
Trader
A
 27.3K @StockChaser_
 Bullish
ZETA is expected to show a strong move, recommended to watch
 27
27
 4
4
 3.0K
3.0K
2026-06-20 22:12
Trend of ZETA after release
Bullish
ZETA is expected to show a strong move, recommended to watch

The Defiant
Media
Influencer
D
363.4K @DefiantNews Bullish
ZetaChain focuses on the user memory layer, enhancing AI privacy and interoperability, worth attention.
Your AI knows more about you than anyone else, and most of that data lives on servers you don’t control.
@ZetaChain is betting the next AI wave won’t be bigger models, but user-owned memory: one encrypted context layer that travels across models.
Privacy, portability, and AI interoperability in one stack.
Read [media partner]:
https://t.co/BR8MRcgU6e
3
1
1.6K
2026-06-18 18:37
Trend of ZETA after release
Bullish
ZetaChain focuses on the user memory layer, enhancing AI privacy and interoperability, worth attention.

Kevin
TA_Analyst
FA_Analyst
C
24.5K @Kev_Capital_TA Bullish
ZETA bullish backtests key support level; if held, it may form a golden cross and continue rising.
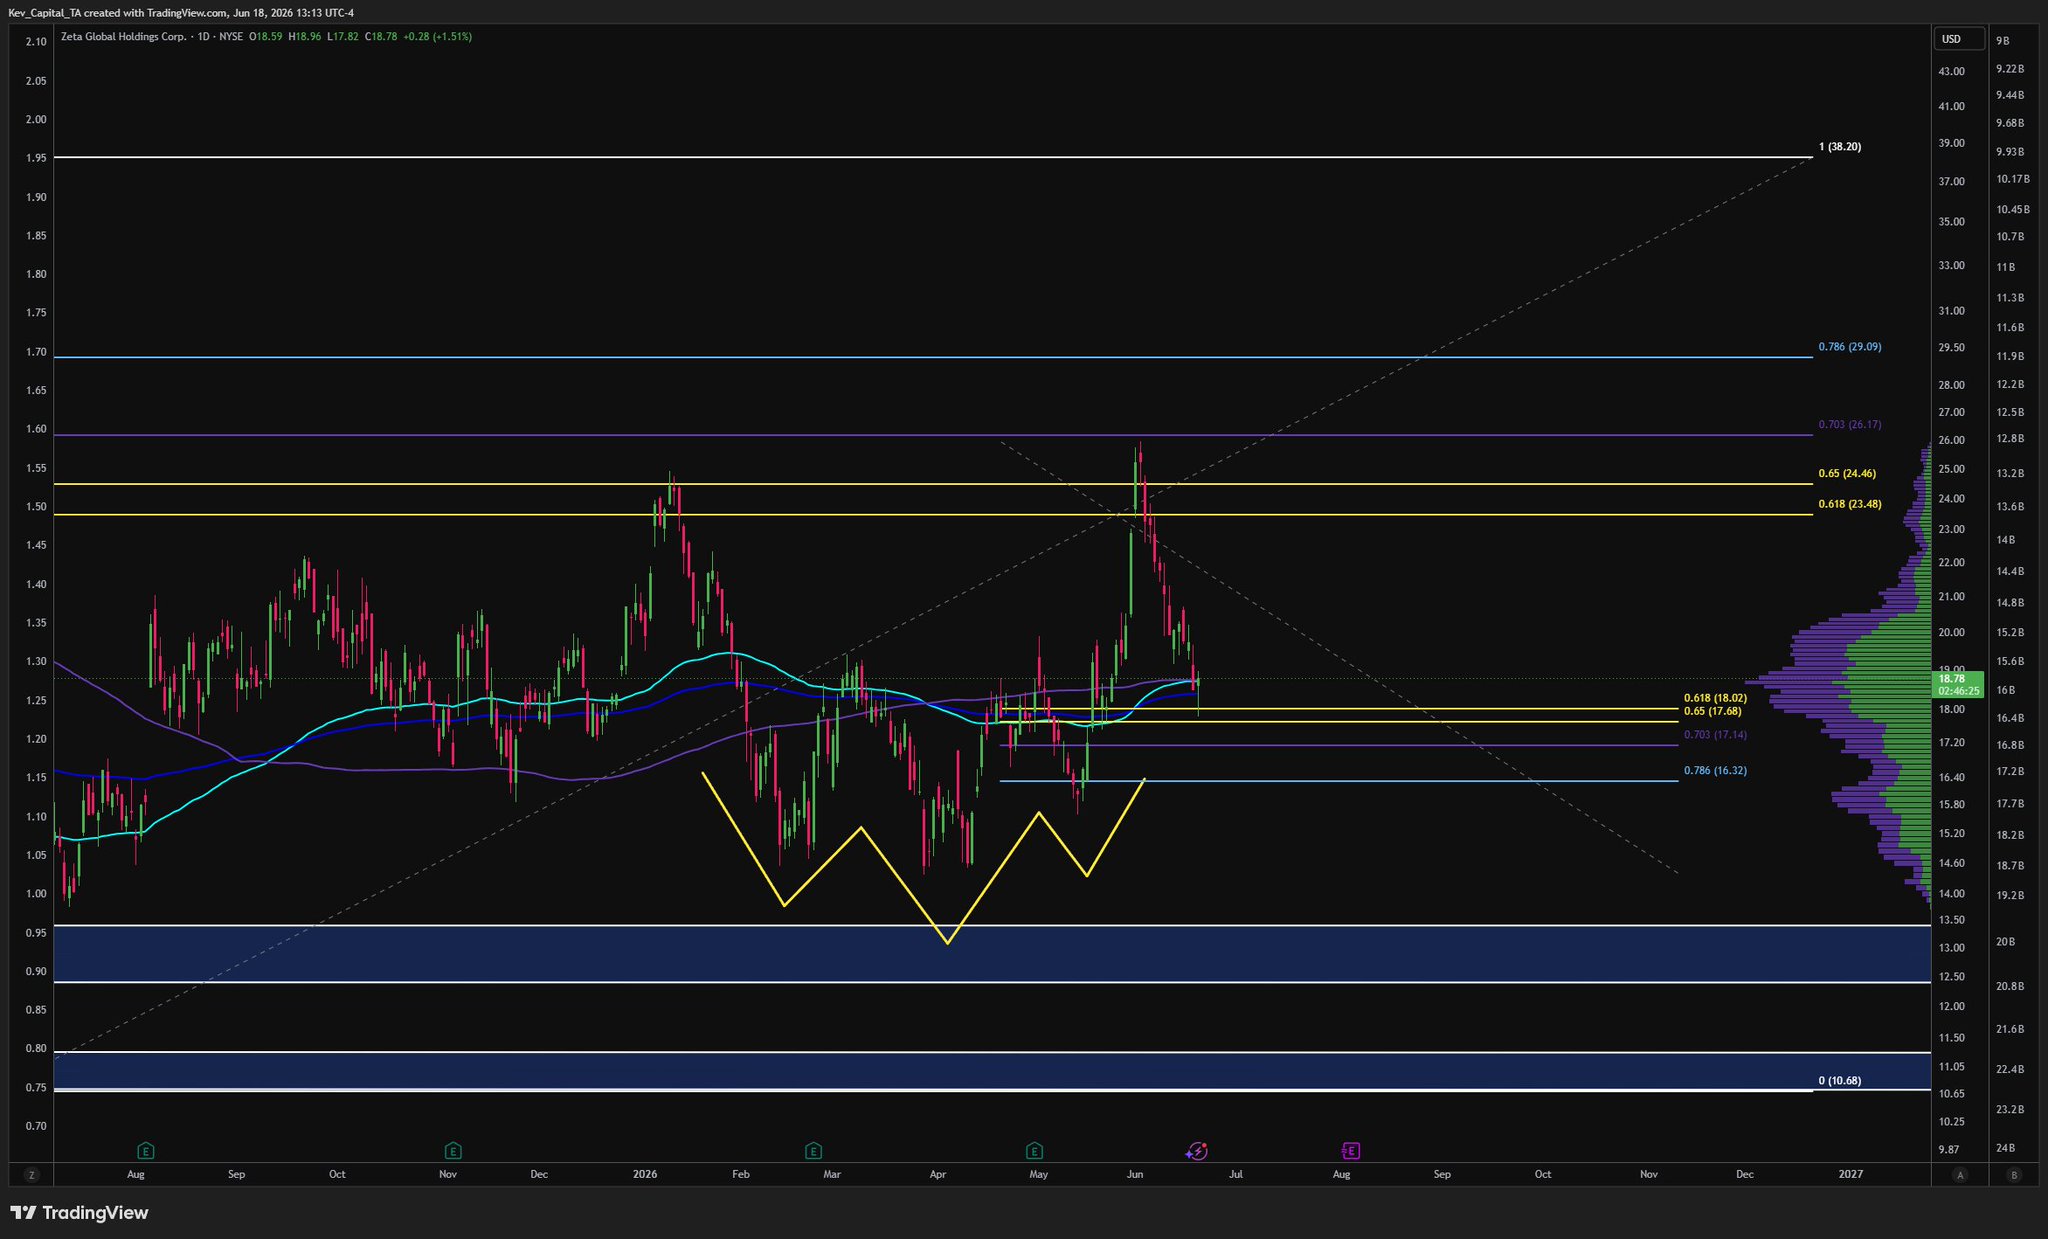
$ZETA Global TA
ZETA recently tested the key $18-$16 range along with the 200D EMA/SMA.
This is still a bullish backtest of the original inverse H&S breakout pattern we identified weeks ago.
The $18-$16 zone is crucial to hold. If it breaks below, ZETA may revert to accumulation.
If it holds, a bullish continuation could push it back toward the significant $23-$29 resistance zone.
Kevin
TA_Analyst
FA_Analyst
C
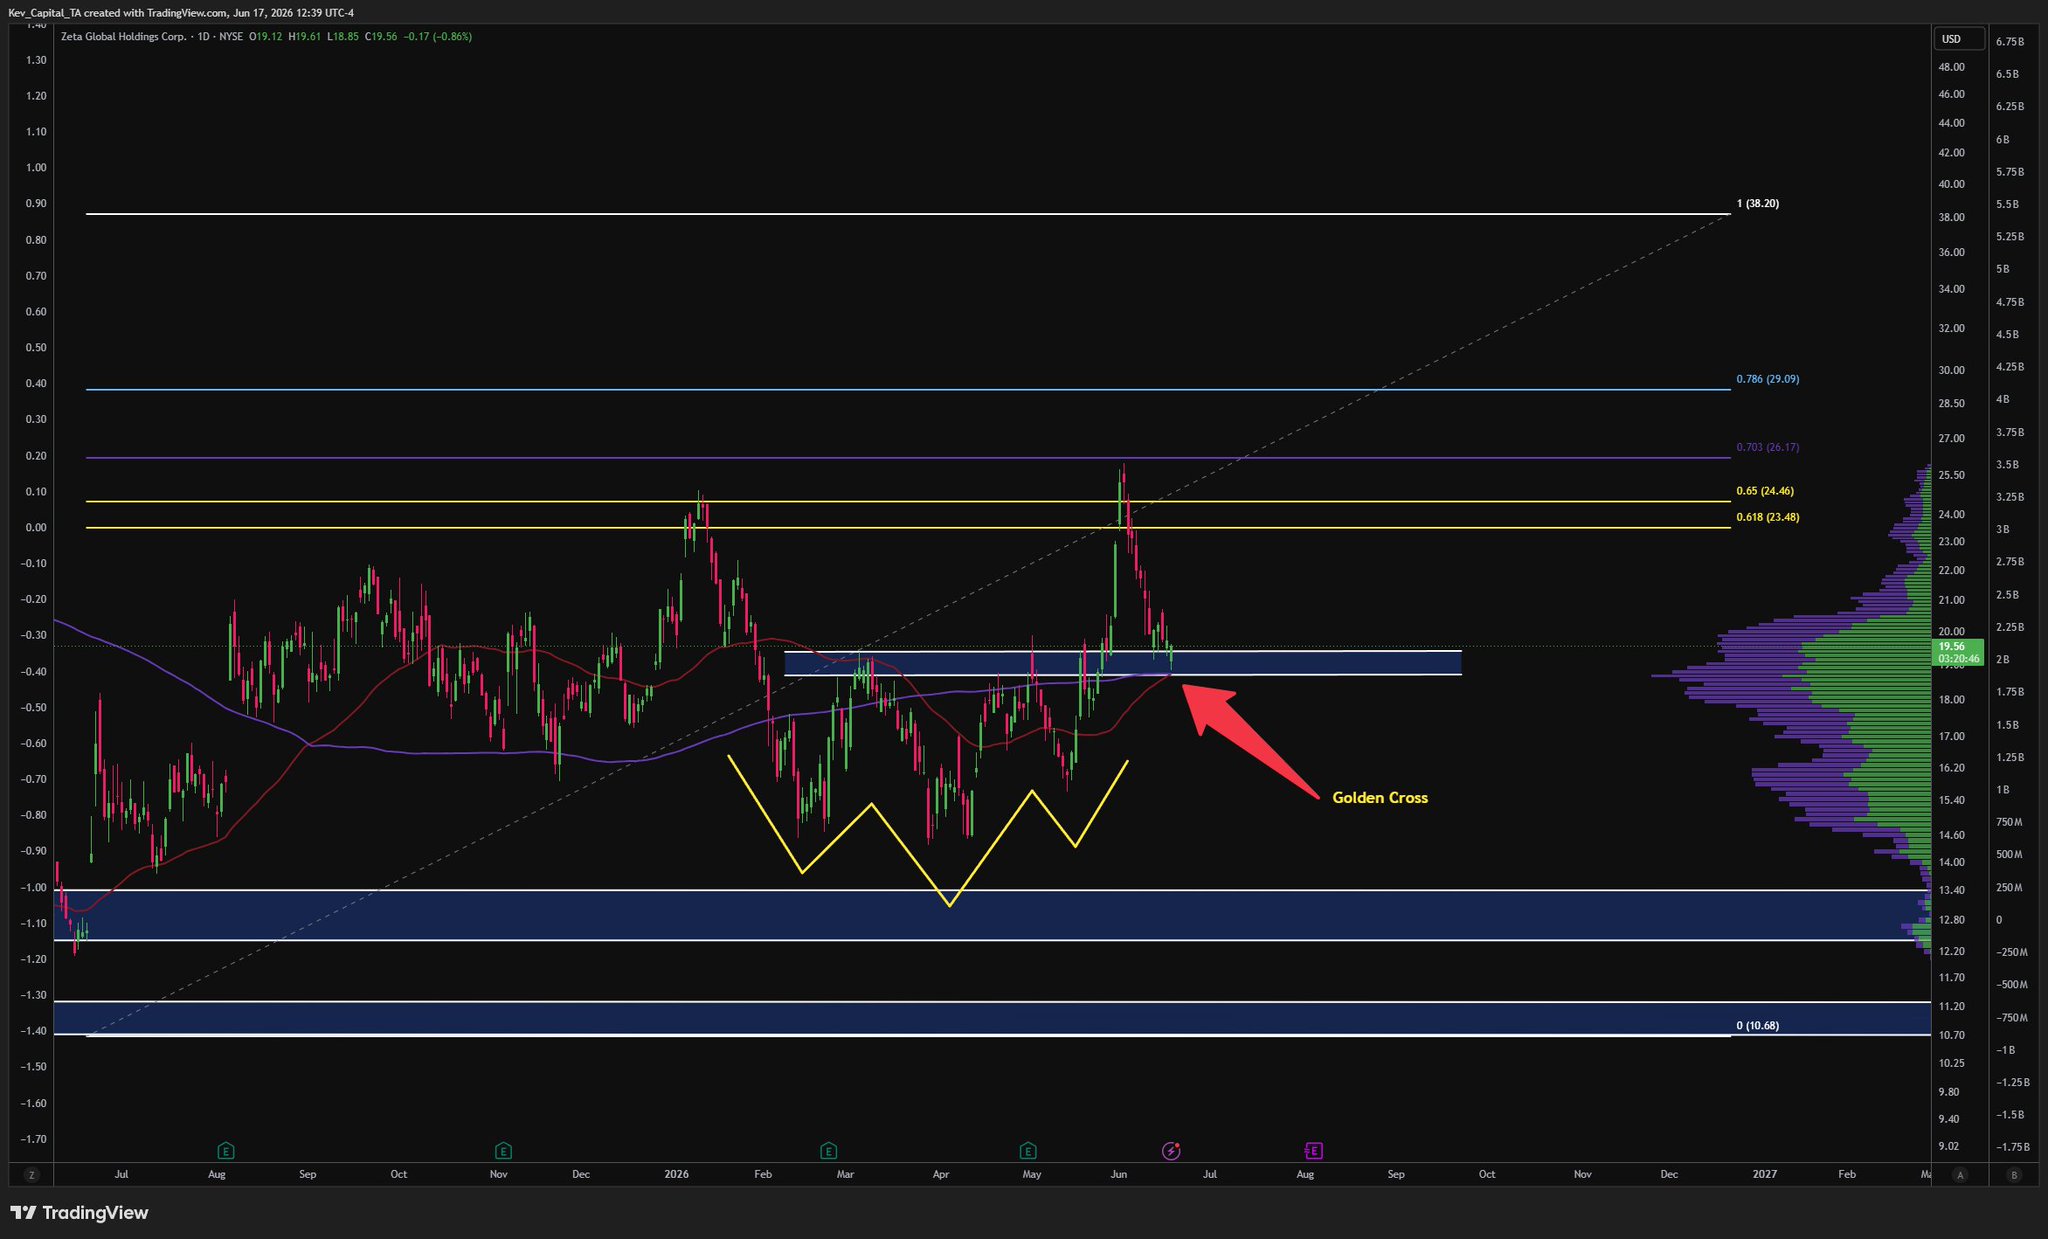
24.5K @Kev_Capital_TA $ZETA Global holders, this is for you.
After breaking out of the inverse H&S pattern I called a week early and then reaching my exact measured move target zone between $23-$29, Zeta is now experiencing a bullish pullback to the neckline of the inverse H&S pattern.
However, something else to watch closely is that while this retest is happening, we're about to see a daily timeframe bullish golden cross at this exact support zone. Pullbacks into golden crosses are completely normal, and the current structure remains bullish.
If Zeta can hold this $20-$18 zone, we will see higher prices. Anything below that zone, and we could be back into accumulation.
 21
1
3.2K
21
1
3.2K
2026-06-18 17:37
Trend of ZETA after release
Bullish
ZETA bullish backtests key support level; if held, it may form a golden cross and continue rising.
Price Prediction
When is a good time to buy ZETA? Should I buy or sell ZETA now?
When deciding whether it’s a good time to buy or sell ZetaChain (ZETA), it’s important to first align with your own trading strategy and risk profile.Long-term investors and short-term traders often interpret market conditions differently, so your decision should reflect your personal approach. According to the latest ZETA 4-hour technical analysis, the current trading signal is Hold. According to the latest ZETA 1-day technical analysis, the current signal is Hold.

Beacon Prediction
Probabilistic Price Forecast (Next 24 Hours)Beacon Prediction Disclaimer
The data results displayed on this page are analyzed based on actual trading data (OHLCV) of the selected trading pair along with corresponding technical indicators.
This prediction is an experimental technical product and is provided for reference purposes only. It does not constitute investment advice. Unexpected real-world events may significantly impact market behavior. Traders should make decisions with caution.
This prediction is an experimental technical product and is provided for reference purposes only. It does not constitute investment advice. Unexpected real-world events may significantly impact market behavior. Traders should make decisions with caution.
About ZetaChain
ZetaChain (ZETA) is a cryptocurrency launched in 2021and operates on the Ethereum platform. ZetaChain has a current supply of 2,100,000,000 with 1,461,177,083 in circulation. The last known price of ZetaChain is 0.03946365 USD and is up 2.33 over the last 24 hours. It is currently trading on 181 active market(s) with $4,946,295.59 traded over the last 24 hours. More information can be found at https://zetachain.com.
Read More
Official Links