
Canaan Inc (CAN) announced that it will acquire a 49% stake in Cipher Mining (CIFR) owned by ABC Projects (Alborz LLC, Bear LLC, Chief Mountain LLC) by issuing 806.4 million Class A common shares (equivalent to 53.8 million American Depositary Receipts). The transaction amount is $39.75 million, and the shares are subject to a six‑month lock‑up period. (CoinDesk)
https://t.co/fLgaYUcy2k
Rewards
Futures Daily Draw
100% Chance To Win With Daily Trades
Spot Daily Draw
Win 8,888 USDT In Grand Prizes
Mobile Top-Up
Top up mobiles easily, online, secure
Send
Send money globally, fast and secure
BitMart Mall
Live on crypto

Channels (CAN)
$ 0.00023 (CAN/USD)
0.00%
24H
Channels CAN Price History USD
Track the price of Channels for today, 7 days, 30 days and 90 days
Period
Change
Change (%)
Today
$ 0
0.00%
7days
$ 0.0000099
4.17%
30days
$ 0.000019
-7.41%
90days
$ 0.000019
-7.41%
Own CAN Now
Buy and sell CAN easily and securely on BitMart.
Channels Market Information
$ 0.00023 24h Range $ 0.00024
All time high
$ 92.29
All time low
$ 0.00012
24h Change
0.00%
24h Vol
$ 0
Circulating supply
0.00
CAN
Market cap
$ 0
Max supply
1.00B
CAN
Fully diluted market cap
$ 239.70K
Trade CAN
Channels X Insight

吴说区块链
Media
Educator
D
 177.6K @wublockchain12
 Neutral
Canaan acquires 49% stake in Cipher Mining with the issuance of 806.4 million shares, transaction amount $39.75 million
 1
1
 1
1
 358
358
2026-02-24 11:21
Trend of CAN after release
Neutral
Canaan acquires 49% stake in Cipher Mining with the issuance of 806.4 million shares, transaction amount $39.75 million
Ace of Trades
TA_Analyst
Trader
C
14.6K @acethebullly Neutral
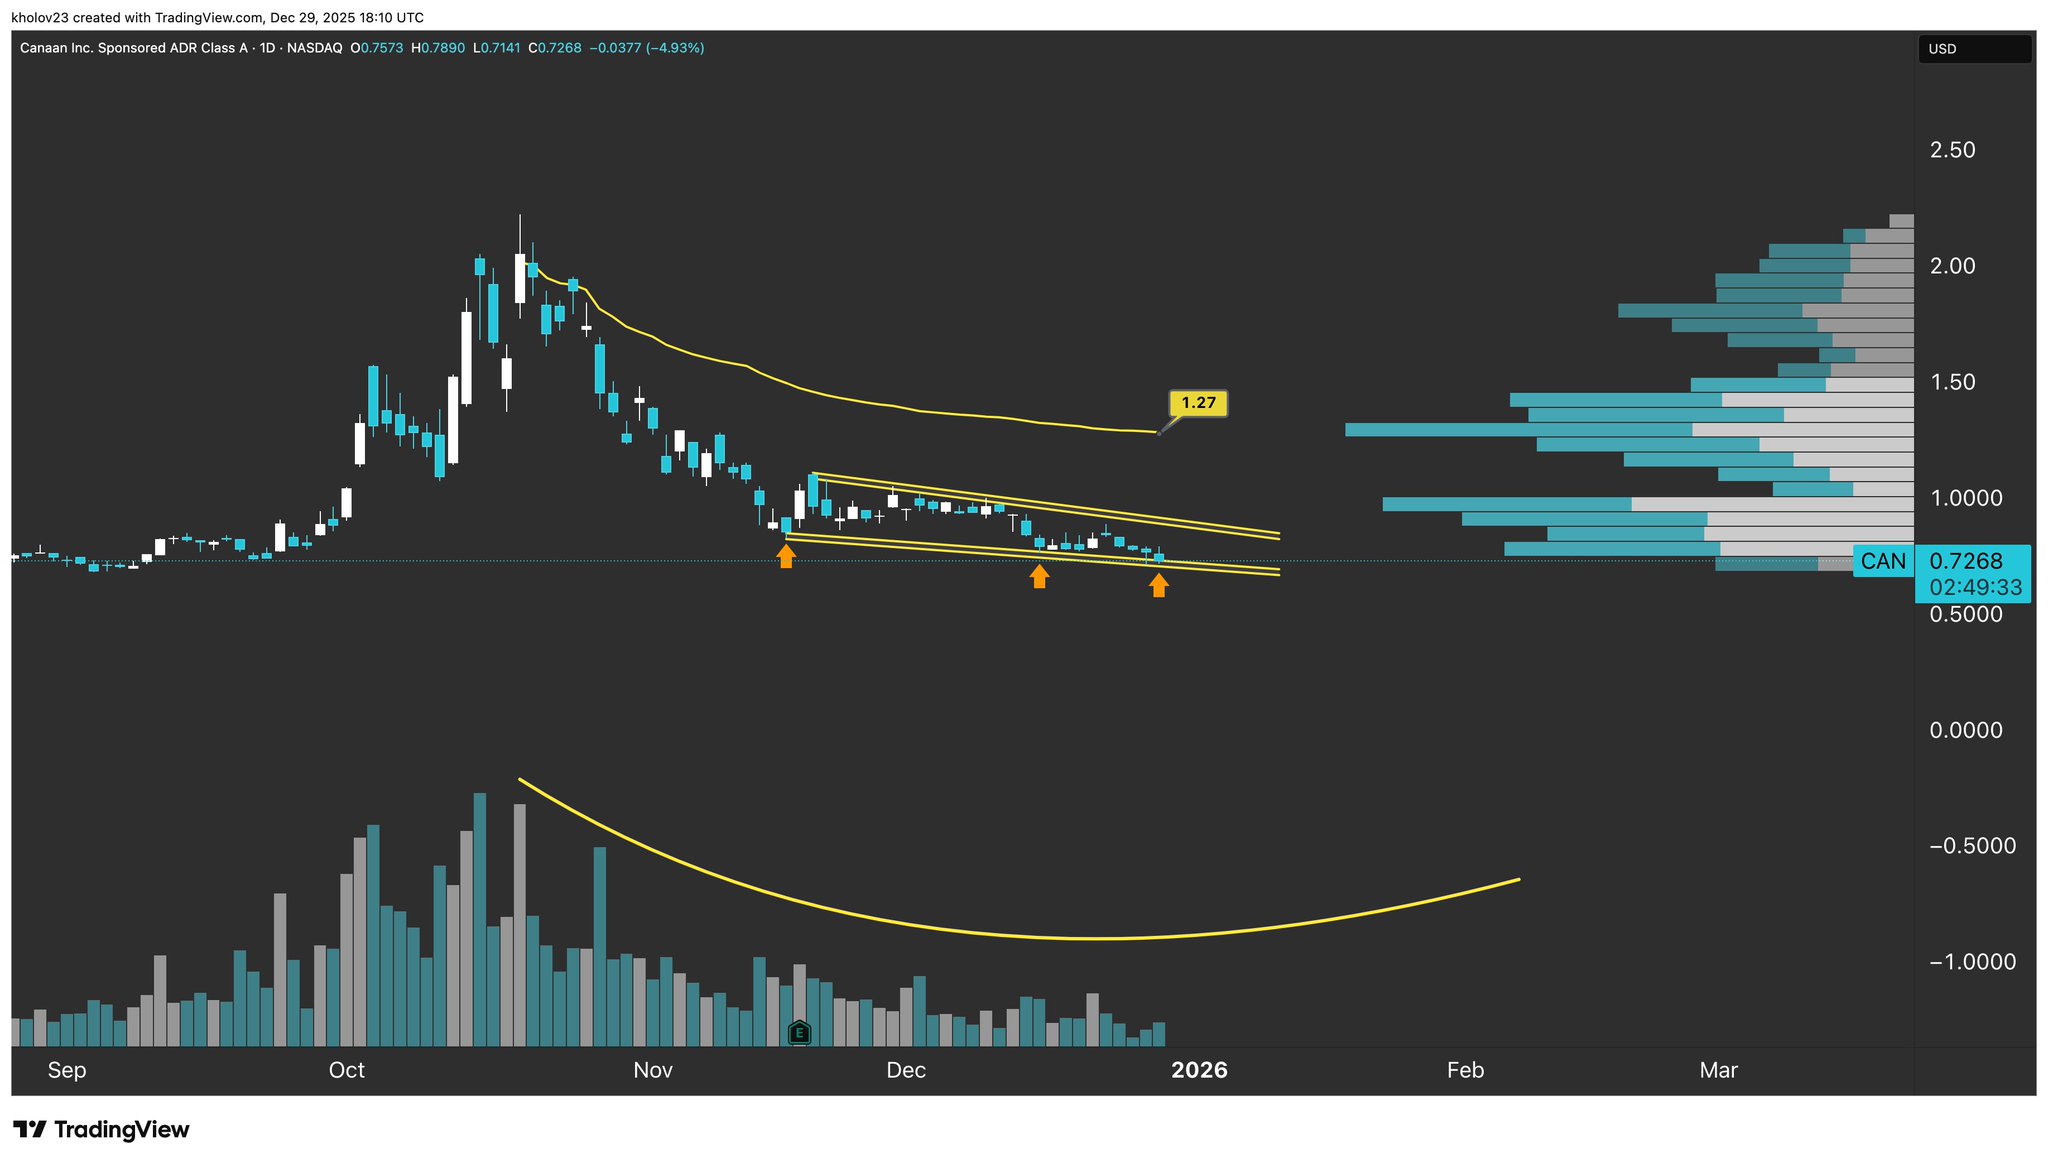
CAN price has touched the descending channel support level for the third time, indicating a potential technical rebound opportunity.
$CAN

Mr Chart Norris D
20.1K @kholov23 $CAN Daily Candle Chart
Thats your THIRD touch
 7
1
2.2K
7
1
2.2K
2025-12-29 23:27
Trend of CAN after release
Neutral
CAN price has touched the descending channel support level for the third time, indicating a potential technical rebound opportunity.
Ace of Trades
TA_Analyst
Trader
C
14.6K @acethebullly Bullish
CAN is consolidating in the 0.87‑1.03 range, fundamentals are favorable, and short-term support remains.
Stop crying 😭
This guy just handed all his gains back on a silver platter.
Classic bag holder move 🤣🤣

Ali Hshrof | ₿ D
349 @Ali_hashroof The chart read is incomplete. $CAN isn’t in a “full bearish alignment” — it’s in a low-volume accumulation range.
Price has been moving sideways between $0.87–$1.03, which is classic post-capitulation basing, not institutional selling. Distribution requires surging volume and breakdown candles — none of which are present. The flattening volatility, thin Ichimoku cloud, and neutral OBV all point to absorption, not rejection.
Calling it a downtrend across all timeframes ignores the fundamental catalysts now stacking beneath the chart:
• Frost & Sullivan ranks Canaan #2 globally in ASIC compute power
• Q3 revenue beat expectations with strong YoY growth
• New partnerships: SynVista Energy (green compute + AI load balancing) and SLNH hosting
• Expanding footprint: Canada, Japan, Ethiopia, North America
• Zero meaningful short interest + 106 institutional holders
• Active share-buyback program
• Industry shift toward efficient ASIC compute (AI + BTC heat-reuse + clean-power mining)
These are not the signals of
0
0
360
2025-12-04 21:57
Trend of CAN after release
Bullish
CAN is consolidating in the 0.87‑1.03 range, fundamentals are favorable, and short-term support remains.
Price Prediction
When is a good time to buy CAN? Should I buy or sell CAN now?
When deciding whether it’s a good time to buy or sell Channels (CAN), it’s important to first align with your own trading strategy and risk profile.Long-term investors and short-term traders often interpret market conditions differently, so your decision should reflect your personal approach. According to the latest CAN 4-hour technical analysis, the current trading signal is Sell. According to the latest CAN 1-day technical analysis, the current signal is Hold.

Beacon Prediction
Probabilistic Price Forecast (Next 24 Hours)Beacon Prediction Disclaimer
The data results displayed on this page are analyzed based on actual trading data (OHLCV) of the selected trading pair along with corresponding technical indicators.
This prediction is an experimental technical product and is provided for reference purposes only. It does not constitute investment advice. Unexpected real-world events may significantly impact market behavior. Traders should make decisions with caution.
This prediction is an experimental technical product and is provided for reference purposes only. It does not constitute investment advice. Unexpected real-world events may significantly impact market behavior. Traders should make decisions with caution.
About Channels
Channels (CAN) is a cryptocurrency launched in 2021and operates on the BNB Smart Chain (BEP20) platform. Channels has a current supply of 1,000,000,000 with 0 in circulation. The last known price of Channels is 0.0002423 USD and is up 2.07 over the last 24 hours. It is currently trading on 20 active market(s) with $0.00 traded over the last 24 hours. More information can be found at https://bsc.channels.finance/.
Read More
Official Links
Chain Explorer
Explore More
BM Discovery


New Listing

ATEG ATEG.DV
-- 0.00%

GCOIN G COIN
-- 0.00%

ISK$ Iskander Coin
-- 0.00%

$BLAST SafeBLAST
-- 0.00%

SPYON SPDR S&P 500 Tokenized ETF (Ondo)
-- 0.00%

QQQON Invesco QQQ Tokenized ETF (Ondo)
-- 0.00%

MCDON McDonald's Tokenized Stock (Ondo)
-- 0.00%

MSTRON MicroStrategy Tokenized Stock (Ondo)
-- 0.00%

AVGOON Broadcom Tokenized Stock (Ondo)
-- 0.00%

CRCLON Circle Internet Group Tokenized Stock (Ondo)
-- 0.00%