

you can choose:
get fucked and lose money or understand how they move and choose when, where and what to risk and what not
Rewards
Futures Daily Draw
100% Chance To Win With Daily Trades
Spot Daily Draw
Win 8,888 USDT In Grand Prizes
Mobile Top-Up
Top up mobiles easily, online, secure
Send
Send money globally, fast and secure
BitMart Mall
Live on crypto
Pepe Live Price data
Today's price of Pepe Is $ 0.0000026 (PEPE/USD). With A Market Cap Of $ 1.10B USD. 24-Hour Trading Volume Of $ 8.53M USD, A 24-Hour Price Change Of -1.12%, And A Circulating Supply Of 413772.47B PEPE.
Pepe PEPE Price History USD
Track the price of Pepe for today, 7 days, 30 days and 90 days
Period
Change
Change (%)
Today
$ 0.000000024
-0.92%
7days
$ 0.00000026
10.87%
30days
$ 0.00000014
-5.35%
90days
$ 0.00000083
-24.03%
Own PEPE Now
Buy and sell PEPE easily and securely on BitMart.
Pepe Market Information
$ 0.0000026 24h Range $ 0.0000027
All time high
$ 0.000028
All time low
$ 0.00000017
24h Change
-1.12%
24h Vol
$ 8,526,884.95
Circulating supply
413.77T
PEPE
Market cap
$ 1.10B
Max supply
413.77T
PEPE
Fully diluted market cap
$ 1.10B
Trade PEPE
Pepe X Insight

ƓIΛΝ⛓🐍
OnChain_Analyst
Tokenomics_Expert
B
 1.2K @wanagiamma
 Bearish
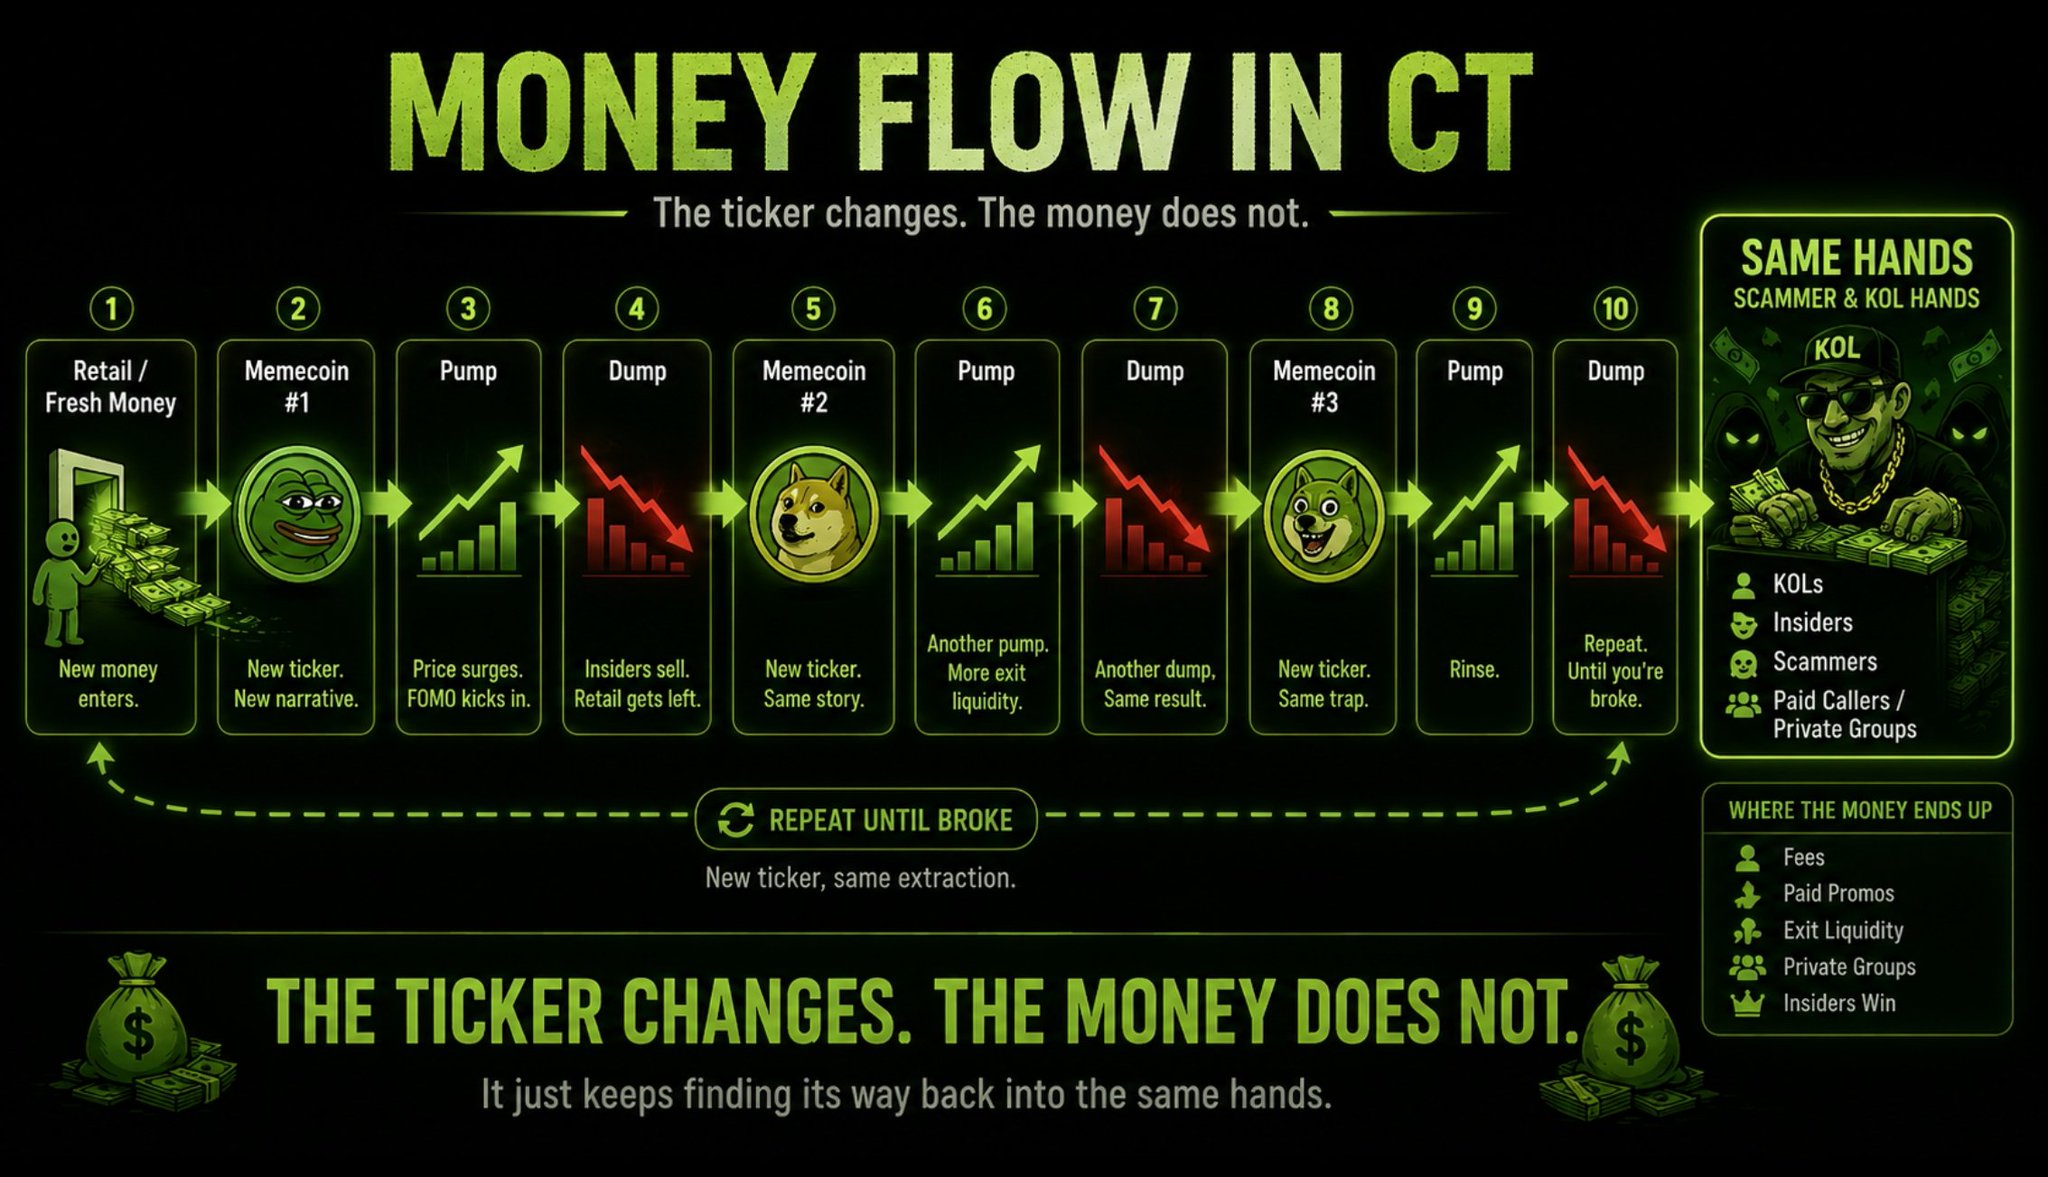
The tweet reveals a Meme coin market manipulation cycle, with retail funds repeatedly flowing to insiders.

MASTR
Security_Expert
OnChain_Analyst
B
30.6K @MastrXYZ The money flow on CT, briefly explained.
No words needed. https://t.co/uLGVmPIIGc
 0
0
 0
0
 44
44
2026-07-04 12:27
Trend of PEPE after release
Extremely Bearish
The tweet reveals a Meme coin market manipulation cycle, with retail funds repeatedly flowing to insiders.
MASTR
Security_Expert
OnChain_Analyst
B
30.6K @MastrXYZ Bearish
The tweet reveals a Meme coin market manipulation cycle, with retail funds repeatedly flowing to insiders.
The money flow on CT, briefly explained.
No words needed. https://t.co/uLGVmPIIGc
79
12
4.1K
2026-07-04 12:12
Trend of PEPE after release
Extremely Bearish
The tweet reveals a Meme coin market manipulation cycle, with retail funds repeatedly flowing to insiders.

levithefirst
OnChain_Analyst
Educator
B
4.9K @levithefirst Bearish
The tweet satirizes retail investors being used as the whales' “exit liquidity” in the crypto market.
0
0
0
2026-07-04 08:57
Trend of PEPE after release
Extremely Bearish
The tweet satirizes retail investors being used as the whales' “exit liquidity” in the crypto market.
Price Prediction
When is a good time to buy PEPE? Should I buy or sell PEPE now?
When deciding whether it’s a good time to buy or sell Pepe (PEPE), it’s important to first align with your own trading strategy and risk profile.Long-term investors and short-term traders often interpret market conditions differently, so your decision should reflect your personal approach. According to the latest PEPE 4-hour technical analysis, the current trading signal is Hold. According to the latest PEPE 1-day technical analysis, the current signal is Sell.

Beacon Prediction
Probabilistic Price Forecast (Next 24 Hours)Beacon Prediction Disclaimer
The data results displayed on this page are analyzed based on actual trading data (OHLCV) of the selected trading pair along with corresponding technical indicators.
This prediction is an experimental technical product and is provided for reference purposes only. It does not constitute investment advice. Unexpected real-world events may significantly impact market behavior. Traders should make decisions with caution.
This prediction is an experimental technical product and is provided for reference purposes only. It does not constitute investment advice. Unexpected real-world events may significantly impact market behavior. Traders should make decisions with caution.
About Pepe
Pepe (PEPE) is a cryptocurrency launched in 2023and operates on the Ethereum platform. Pepe has a current supply of 413,772,473,088,271.90068741. The last known price of Pepe is 0.00000235 USD and is down -0.95 over the last 24 hours. It is currently trading on 678 active market(s) with $112,908,841.83 traded over the last 24 hours. More information can be found at https://www.pepe.vip/.
Read More
Explore More
BM Discovery


New Listing

TIVA Intiva Health
-- 0.00%

LOWON Lowe's
-- 0.00%

ENTGON Entegris
-- 0.00%

CIENON Ciena
-- 0.00%

APOON Apollo Global Management
-- 0.00%

HDON Home Depot
-- 0.00%

TERON Teradyne (Ondo Tokenized)
-- 0.00%

ALABON Astera Labs
-- 0.00%

CNT Centel
-- 0.00%

CRDOON Credo Technology Group Holding Ltd
-- 0.00%
Buy PEPE
Trade PEPE