Rewards
Futures Daily Draw
100% Chance To Win With Daily Trades
Spot Daily Draw
Win 8,888 USDT In Grand Prizes
Mobile Top-Up
Top up mobiles easily, online, secure
Send
Send money globally, fast and secure
BitMart Mall
Live on crypto

Peezy 0x69 (PEEZY)
$ 0.00000042 (PEEZY/USD)
7.03%
24H
Peezy 0x69 Live Price data
Today's price of Peezy 0x69 Is $ 0.00000042 (PEEZY/USD). With A Market Cap Of $ 128.45K USD. 24-Hour Trading Volume Of $ 3,361.37 USD, A 24-Hour Price Change Of +7.03%, And A Circulating Supply Of 305.65B PEEZY.
Peezy 0x69 PEEZY Price History USD
Track the price of Peezy 0x69 for today, 7 days, 30 days and 90 days
Period
Change
Change (%)
Today
$ 0.000000027
7.03%
7days
$ 0.000000075
-15.19%
30days
$ 0.00000032
-43.71%
90days
$ 0.000000096
29.88%
Own PEEZY Now
Buy and sell PEEZY easily and securely on BitMart.
Peezy 0x69 Market Information
$ 0.00000039 24h Range $ 0.00000042
All time high
$ 0.00000094
All time low
$ 0.00000018
24h Change
7.03%
24h Vol
$ 3,361.37
Circulating supply
305.65B
PEEZY
Market cap
$ 128.45K
Max supply
420.69B
PEEZY
Fully diluted market cap
$ 176.79K
Trade PEEZY

Peezy 0x69 X Insight

davie satoshi
TA_Analyst
NFT_Expert
B
 27.3K @NFTdavie
 Bullish
PEEZY technical analysis shows two paths: bullish if support holds, bearish if it breaks.
davie satoshi
TA_Analyst
NFT_Expert
B
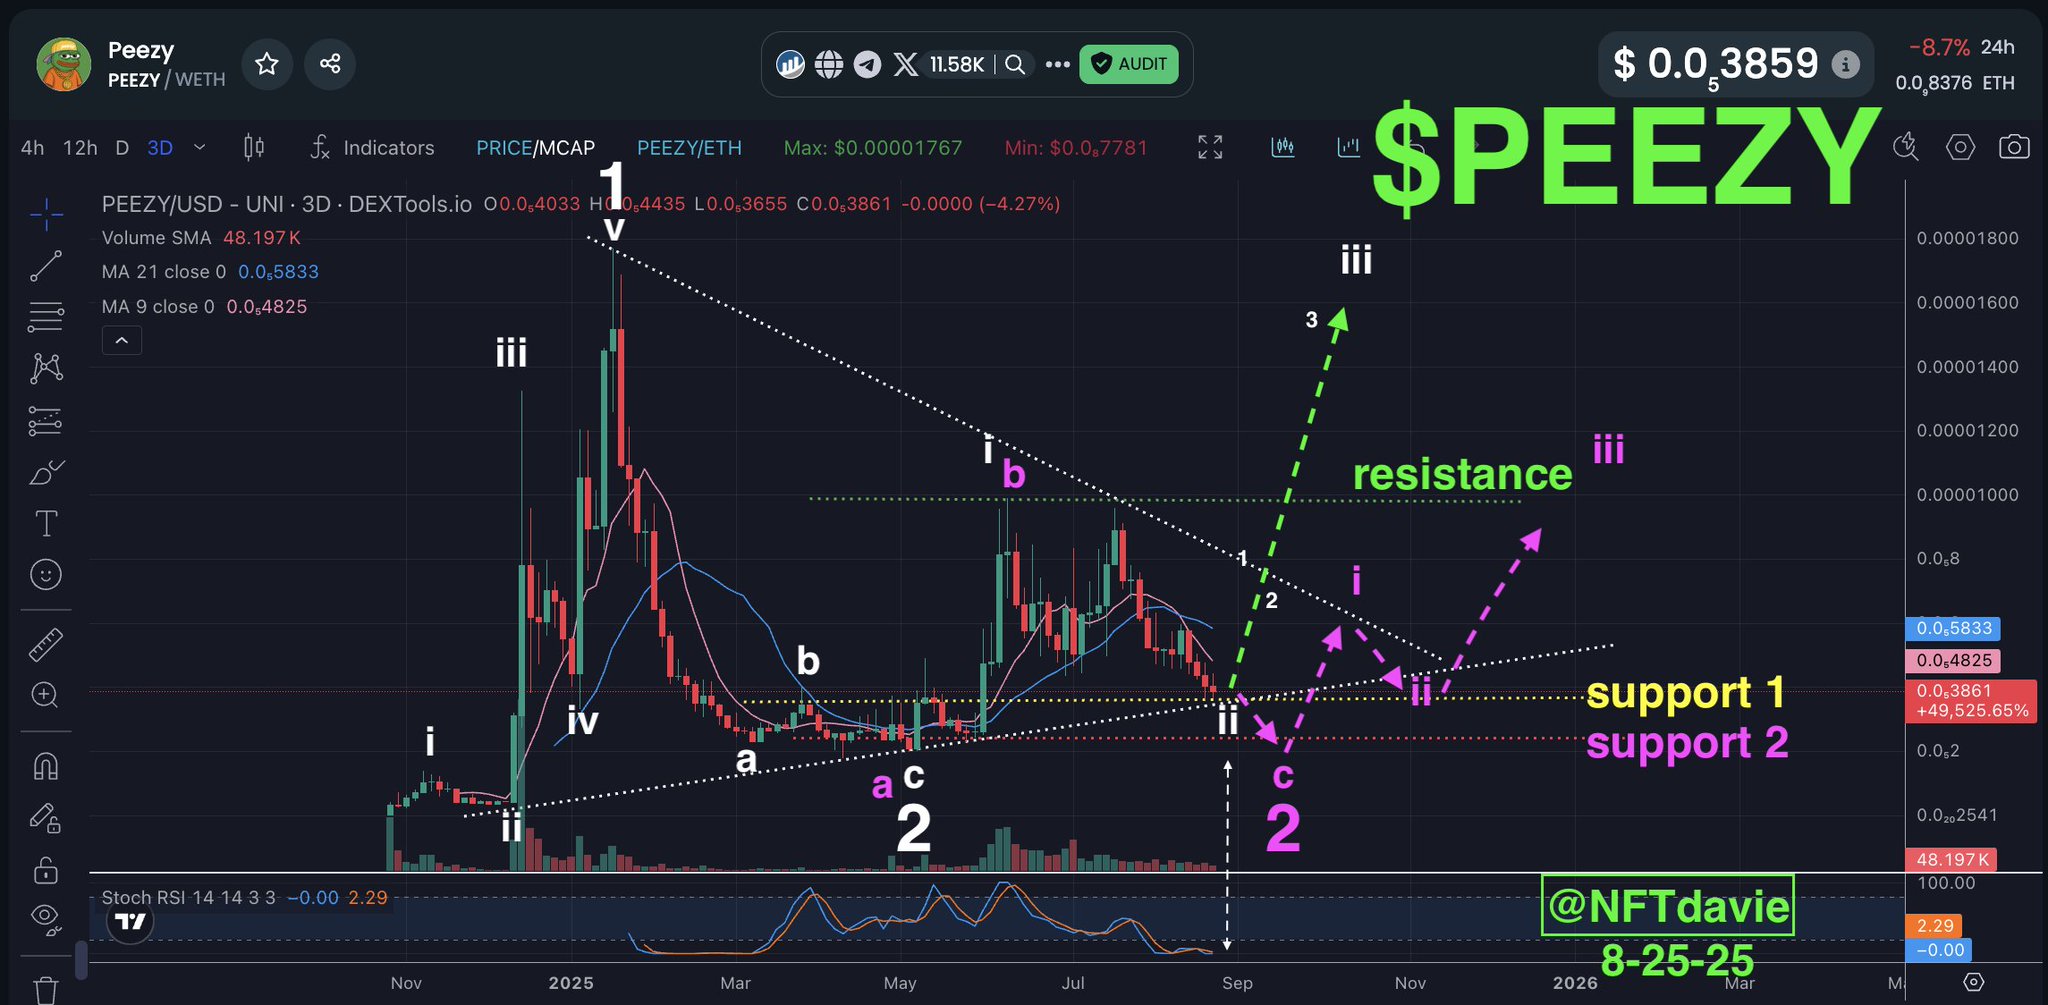
27.3K @NFTdavie Rapid Fire Charts: $PEEZY
PEEZY has many possible routes but here are the two likely routes IMO.
Bullish - GREEN/WHITE - In this scenario, major wave 2 has completed in spring of 2025 and the subsequent waves afterwards are part of major wave 3. We can make out a subwave i of 3 (labeled white i) and wave ii of 3 looks about complete (white ii where we are currently). There are two major support lines here (yellow/white) intersecting which should be strong. That should lead to a bounce here and the beginning of wave iii of 3.
Bearish - PINK - In this scenario, major wave 2 has not completed and $PEEZY is a laggard in the altcoin/memecoin trend. If it falls below the two intersecting support line (yellow and white), then it will fall onto the next one (pink). This does correspond better with the historic low stoch RSI reading on the 3 day chart as the low readings tend to correlate to major wave 2's. In this scenario, the climb back up begins with sub wave i and so forth. This scenario paints a picture of th
 42
42
 13
13
 2.8K
2.8K
2025-08-28 19:24
Trend of PEEZY after release
Bullish
PEEZY technical analysis shows two paths: bullish if support holds, bearish if it breaks.

Jools
Dev
Influencer
B
20.1K @jewelsindefi Bullish
Predicting that ETH's rise will lead to buying interest for PEEZY.
When $ETH goes crazy, long standing communities like $PEEZY will eventually catch a bid.
Peezy money.
39
7
1.4K
2025-08-28 13:13
Trend of PEEZY after release
Bullish
Predicting that ETH's rise will lead to buying interest for PEEZY.
davie satoshi
TA_Analyst
NFT_Expert
B
27.3K @NFTdavie Neutral
PEEZY technical analysis shows two paths: bullish if support holds, bearish if it breaks.
Rapid Fire Charts: $PEEZY
PEEZY has many possible routes but here are the two likely routes IMO.
Bullish - GREEN/WHITE - In this scenario, major wave 2 has completed in spring of 2025 and the subsequent waves afterwards are part of major wave 3. We can make out a subwave i of 3 (labeled white i) and wave ii of 3 looks about complete (white ii where we are currently). There are two major support lines here (yellow/white) intersecting which should be strong. That should lead to a bounce here and the beginning of wave iii of 3.
Bearish - PINK - In this scenario, major wave 2 has not completed and $PEEZY is a laggard in the altcoin/memecoin trend. If it falls below the two intersecting support line (yellow and white), then it will fall onto the next one (pink). This does correspond better with the historic low stoch RSI reading on the 3 day chart as the low readings tend to correlate to major wave 2's. In this scenario, the climb back up begins with sub wave i and so forth. This scenario paints a picture of th
42
13
2.8K
2025-08-25 16:15
Trend of PEEZY after release
Neutral
PEEZY technical analysis shows two paths: bullish if support holds, bearish if it breaks.
Price Prediction
When is a good time to buy PEEZY? Should I buy or sell PEEZY now?
When deciding whether it’s a good time to buy or sell Peezy 0x69 (PEEZY), it’s important to first align with your own trading strategy and risk profile.Long-term investors and short-term traders often interpret market conditions differently, so your decision should reflect your personal approach. According to the latest PEEZY 4-hour technical analysis, the current trading signal is Sell. According to the latest PEEZY 1-day technical analysis, the current signal is Hold.

Beacon Prediction
Probabilistic Price Forecast (Next 24 Hours)Beacon Prediction Disclaimer
The data results displayed on this page are analyzed based on actual trading data (OHLCV) of the selected trading pair along with corresponding technical indicators.
This prediction is an experimental technical product and is provided for reference purposes only. It does not constitute investment advice. Unexpected real-world events may significantly impact market behavior. Traders should make decisions with caution.
This prediction is an experimental technical product and is provided for reference purposes only. It does not constitute investment advice. Unexpected real-world events may significantly impact market behavior. Traders should make decisions with caution.
About Peezy 0x69
Peezy 0x69 (PEEZY) is a cryptocurrency launched in 2024and operates on the Ethereum platform. Peezy 0x69 has a current supply of 359,709,061,786 with 305,650,329,936 in circulation. The last known price of Peezy 0x69 is 0.00000042 USD and is up 3.95 over the last 24 hours. It is currently trading on 10 active market(s) with $4,363.32 traded over the last 24 hours. More information can be found at https://peezy.vip/.
Read More
Explore More
BM Discovery


New Listing

ZTRA Zentra Privacy
-- 0.00%

GCOIN G COIN
-- 0.00%

ISK$ Iskander Coin
-- 0.00%

$BLAST SafeBLAST
-- 0.00%

SPYON SPDR S&P 500 Tokenized ETF (Ondo)
-- 0.00%

QQQON Invesco QQQ Tokenized ETF (Ondo)
-- 0.00%

MCDON McDonald's Tokenized Stock (Ondo)
-- 0.00%

MSTRON MicroStrategy Tokenized Stock (Ondo)
-- 0.00%

AVGOON Broadcom Tokenized Stock (Ondo)
-- 0.00%

CRCLON Circle Internet Group Tokenized Stock (Ondo)
-- 0.00%