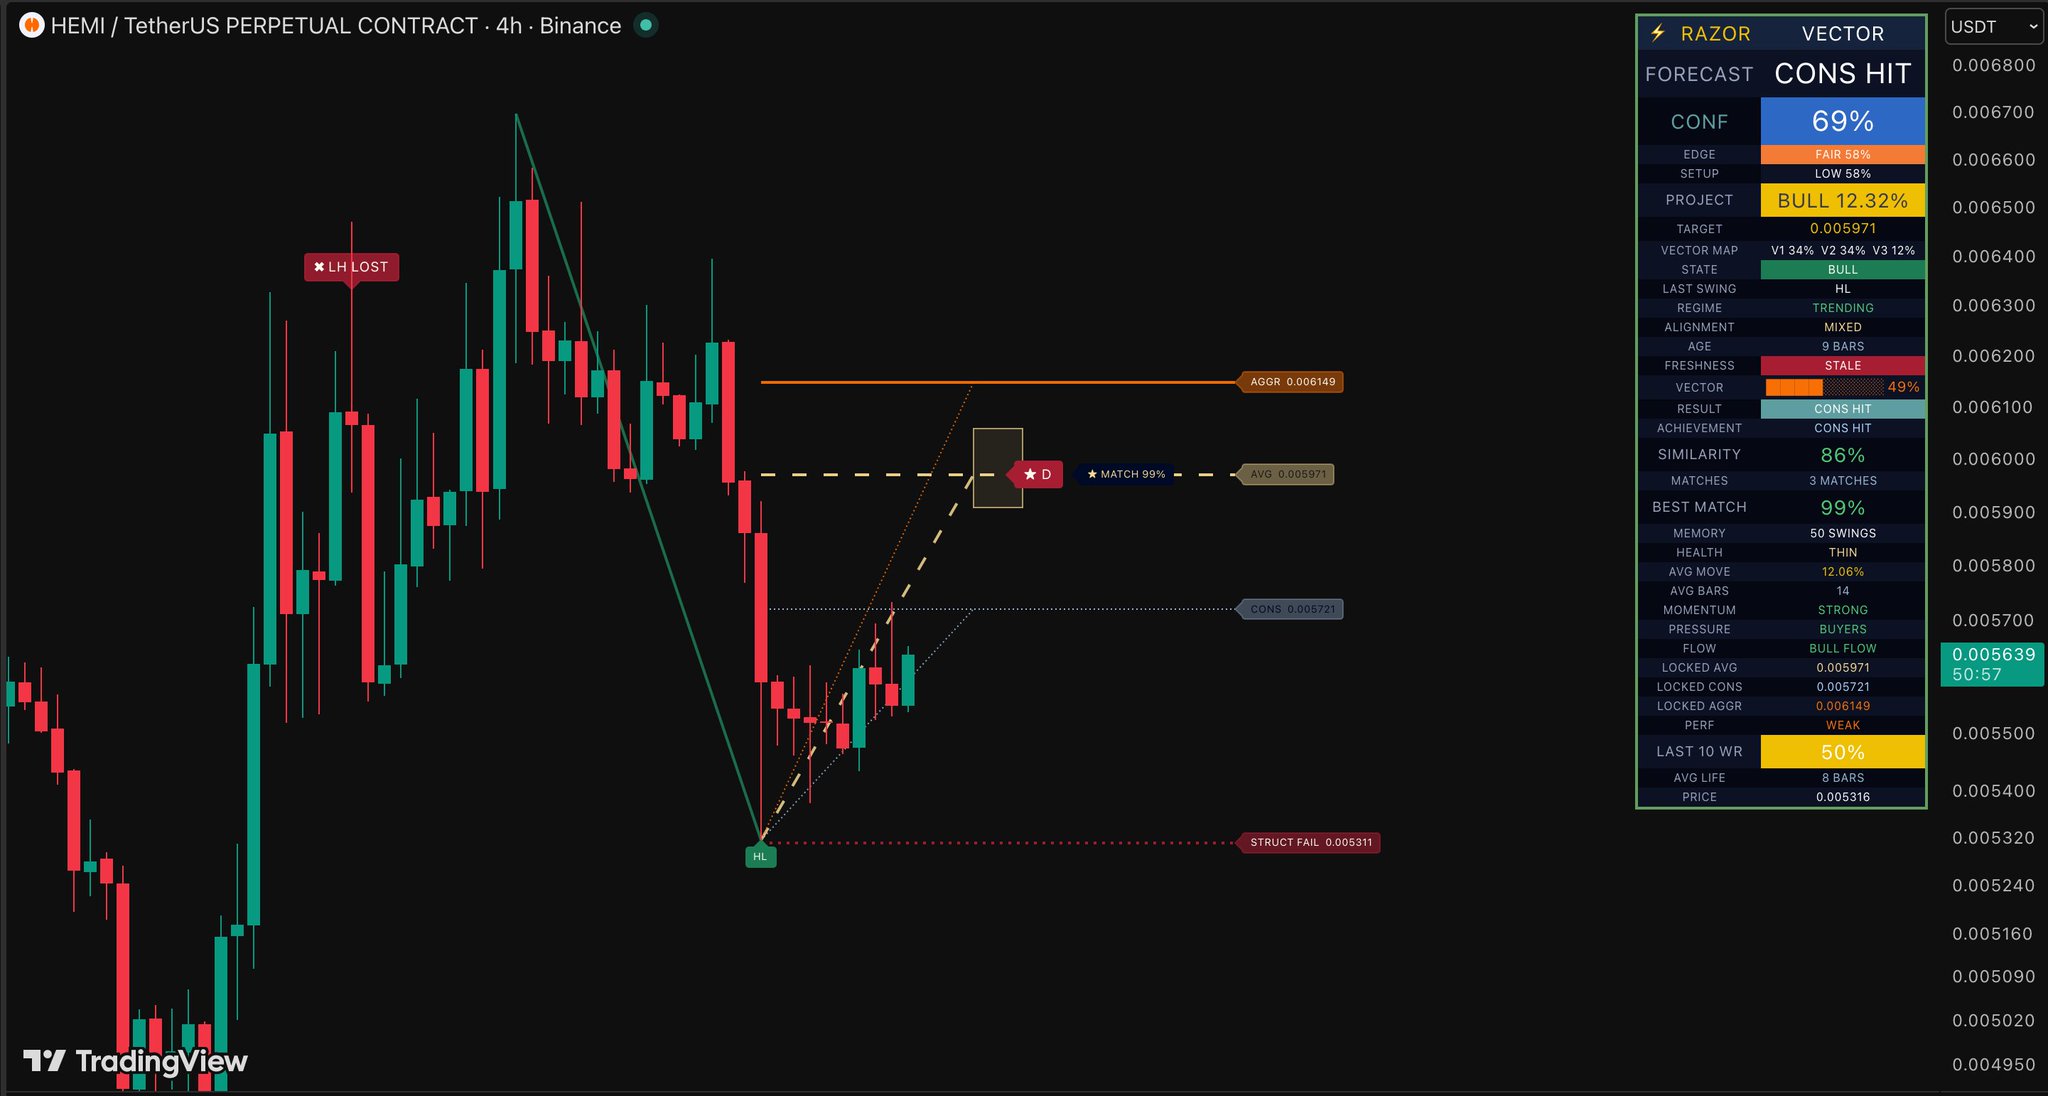
🧪 Testing Razor Vector on $HEMI
First LIVE look at $HEMI on the 4H chart using Razor Vector.
Let's see if $HEMI can continue toward the average projection. https://t.co/t1tXohKlNV

 269.6K @CryptoNewton
 🧪 Testing Razor Vector on $HEMI
First LIVE look at $HEMI on the 4H chart using Razor Vector.
Let's see if $HEMI can continue toward the average projection. https://t.co/t1tXohKlNV
 21
21
 1
1
 3.8K
269.6K @CryptoNewton
3.8K
269.6K @CryptoNewton $HEMI 👀 https://t.co/dqARspTsqR
 34
7
5.6K
34
7
5.6K
 9.3K @nocoffeenobrain
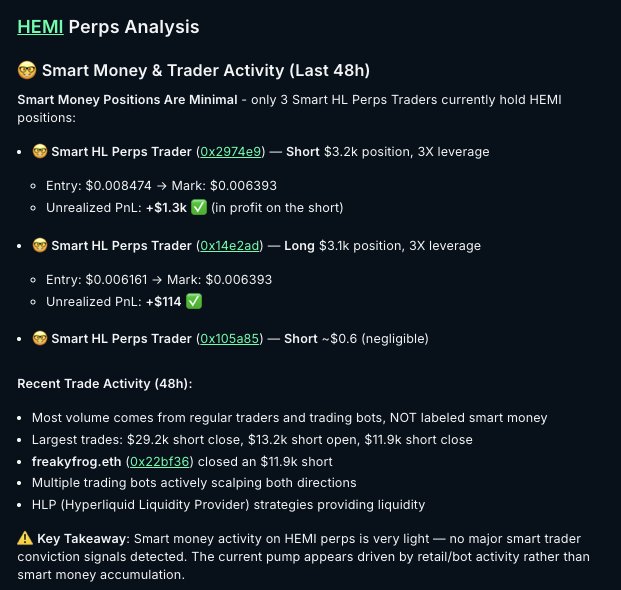
 Got a $HEMI ping earlier today
Opened @nansen_ai, checked smart money + trader activity
Didn't see any strong positioning, that's a good signal for me
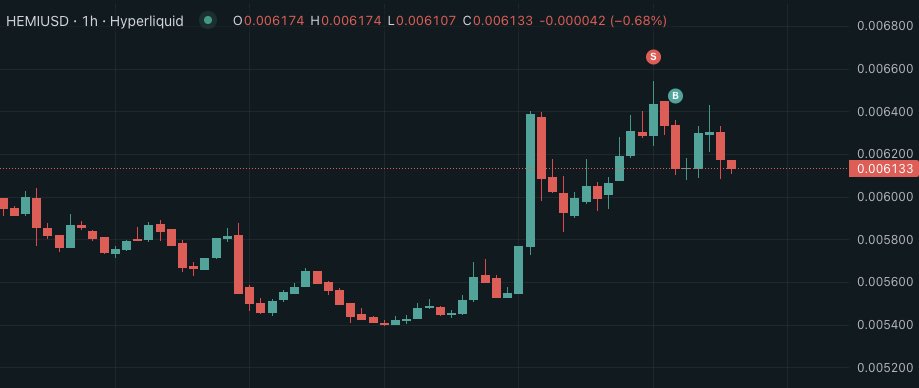
So I opened a 3x short with TP, SL then enjoy this Sunday
Just back home now, TP was hit
We don't have to catch everything
Just checking where the size is, then plan the setup, that's enough
 7
2
249
7
2
249