 MYX Finance (MYX)
- 68社交熱度指數(SSI)- (24h)
- #46市場預警排名(MPR)0
- 124小時社交提及量- (24h)
- 100%24小時KOL看好比例1位活躍KOL
- 概要MYX price up 1.74% to 0.165, KOL monitoring a 4h breakout of the key resistance at 0.17, social heat remains flat.
- 看漲訊號
- 24h gain of 1.74%
- KOL monitoring a 4h break above 0.17
- Price approaching resistance
- Social heat remains flat, no drop
- Slight upward trend
- 看跌訊號
- Current price below 0.17
- Key resistance not broken
- Low engagement with only 9 interactions
- Limited upside
- Short-term pressure remains
社交熱度指數(SSI)
- 總體資料68SSI
- 社交熱度趨勢(7D)價格(7D)情緒分佈看漲 (100%)社交熱度洞察MYX social heat is moderately high (68/100), activity score full (40/40), positive sentiment remains at 27.5/30, KOL attention only 0.5/30, with a slight rise but no resistance breakout, the heat stays flat.
市場預警排名(MPR)
- 預警解讀MYX warning rank #46, social abnormality extremely high (100/100) but KOL attention is zero, sentiment polarization moderate (50/100), an anomaly formed because price hasn't broken resistance and social heat remains flat.
相關推文
 Kurnia Bijaksana Trader Educator C46.87K @mkbijaksana
MYX Make sure 4H candle closes above 0.17 https://t.co/BgsFDk3m8x
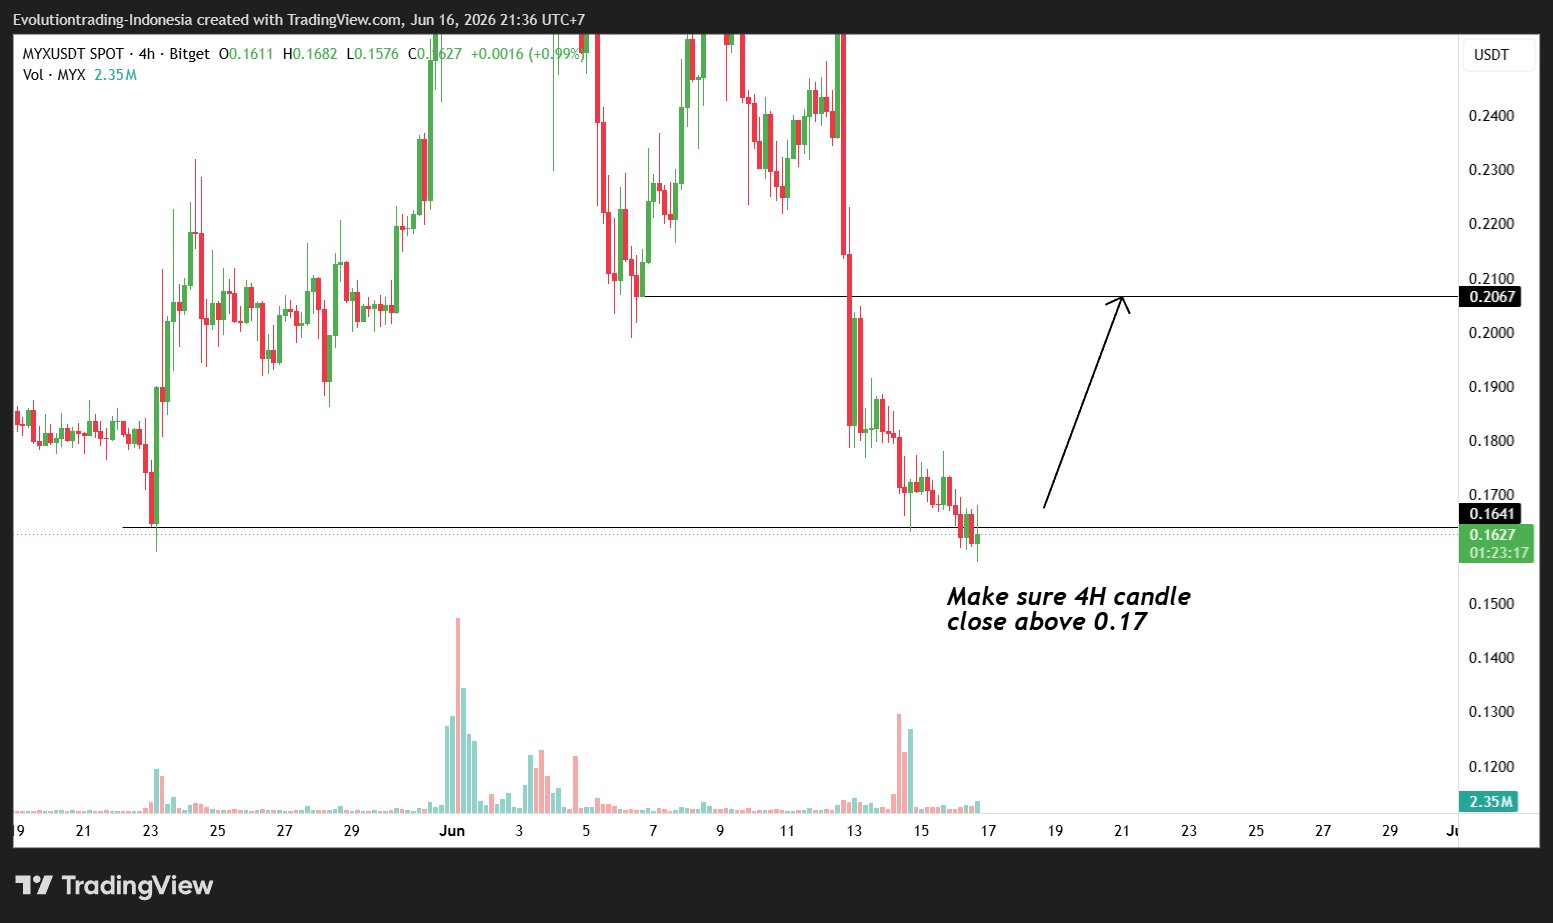 9 0 1.06K 閱讀原文 >釋出後MYX走勢看漲If the 4‑hour candle for MYX closes above 0.17, it is expected to rise to 0.2067.
- Kurnia Bijaksana Trader Educator C46.87K @mkbijaksana
MYX Projection Only if there is a bullish candle forming here https://t.co/S5NZXqP2if
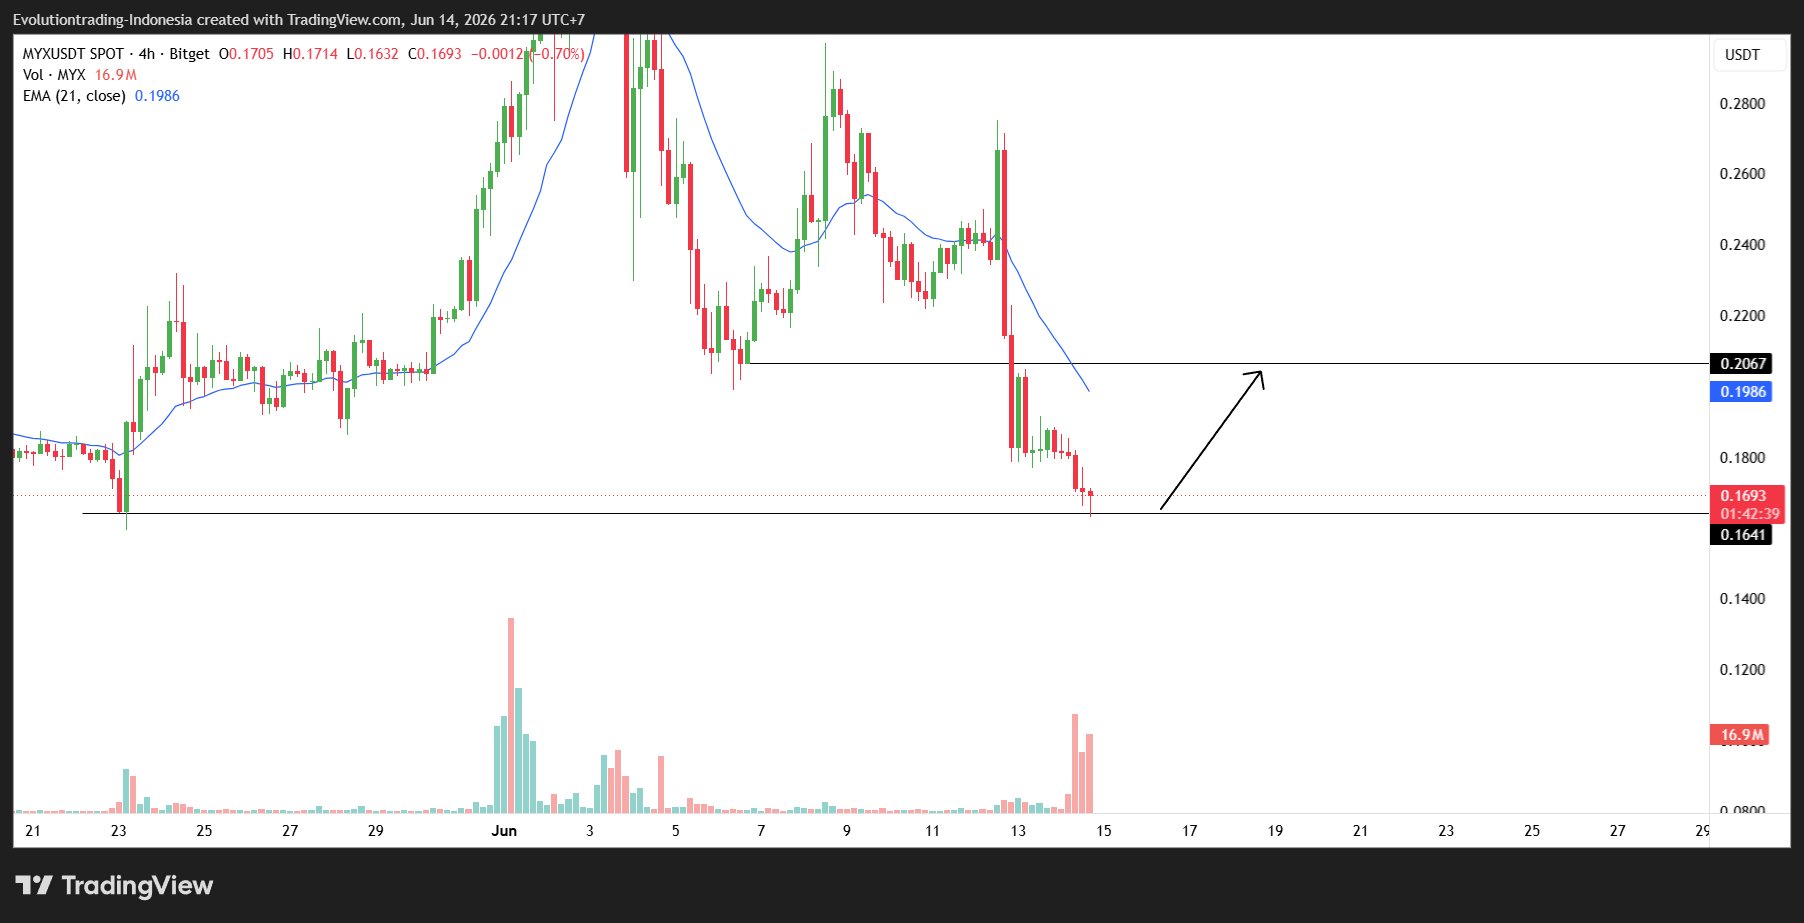 11 1 1.29K 閱讀原文 >釋出後MYX走勢看漲MYX is expected to rebound from the current support level to 0.2067 after a bullish candle forms.
  OCT Trades TA_Analyst Trader B5.22K @oct_trades
We officially declare $MYX as a dead altcoin. You cannot sit at 100X for your 2025 highs and call it upside. It been sideways since March with no big updates. Here's the full timeline 👇 > Profit taking after the massive September 2025 pump to 19 dollars. > Sharp October crash with 38 percent daily and 67 percent weekly drops. > Negative Bitcoin correlation caused capital to rotate out during BTC rallies. > Heavy and ongoing token unlocks flooded supply and added sell pressure. > Bearish technical breakdown with broken supports and weak momentum. > Fading launch hype reduced trader interest and open interest. > High leverage perps market amplified liquidations and downside. > No strong new catalysts to offset the supply and sentiment issues. > Token price fully decoupled from relatively stable protocol usage.
 12 1 1.13K 閱讀原文 >釋出後MYX走勢極度看跌MYX is declared a “dead altcoin” due to its price crash, lack of catalysts, and bearish technical outlook.
 加密小师妹|Monica Educator FA_Analyst C148.02K @Monica_xiaoM
With the fewest words, get the most complete answer, @dappOS_com's @xBubble_ai Recently, Binance Alpha projects have been growing, so I casually asked the AI a very simple question: "Are there any worthwhile projects on Binance Alpha?" In the past, most AIs would first lay out the information for me: which projects are hot, which have just launched, which have airdrops, which are rising sharply. That information is certainly useful, but fundamentally it's still answering: "What is happening now?" The real hassle is the next step: which projects are worth continuing to watch, which are just short‑term sentiment, and where to start verification—these usually still require the user to reorganize. Later I tossed the same question to xBubble. It didn't stop at "list a few projects"; instead it automatically matched a Crypto Research SOP, and the output looked roughly like this: It first provided a judgment framework: within the current Alpha ecosystem, projects that combine the dual heat of "Binance Alpha + Binance Futures" tend to have greater overall elasticity. It then unfolded specific projects and pathways following that framework. For example, it mentioned projects like MYX and ZORA; after Alpha’s added contract heat, their short‑term performance can be exaggerated—one approaching 14×, the other around 7×. Going further, it didn't stop at "which projects to look at"; it also completed the participation methods. For smaller capital, it leans toward a points route: daily logins, completing test‑net tasks, slowly accumulating 230 points to draw an Alpha Box. For larger capital, the route is to stake BNB directly into the Launchpool and receive new token distributions. The two paths differ quite a bit, but it presents them within the same judgment framework rather than listing them separately. It also added some risk information. For example, historical data shows that about 40% of tokens launched on Alpha experience a pullback of over 50% in the short term. This data isn’t necessarily new, but placed within the overall structure it makes the question of "whether to participate" more complete. I realized this might be what sets it apart from many AI tools. Often users don’t know how to phrase a question, let alone which tool to invoke or which research process to follow. What xBubble does is, when a user provides only a simple prompt with a goal, it fills in the missing middle path for the user. Using an SOP system to guarantee that low‑threshold input yields high‑quality output is quite meaningful. Ordinary people shouldn’t be blocked from AI productivity by ever‑rising learning costs. Lowering this barrier isn’t just a matter of stronger models; AI itself must learn how to use AI.
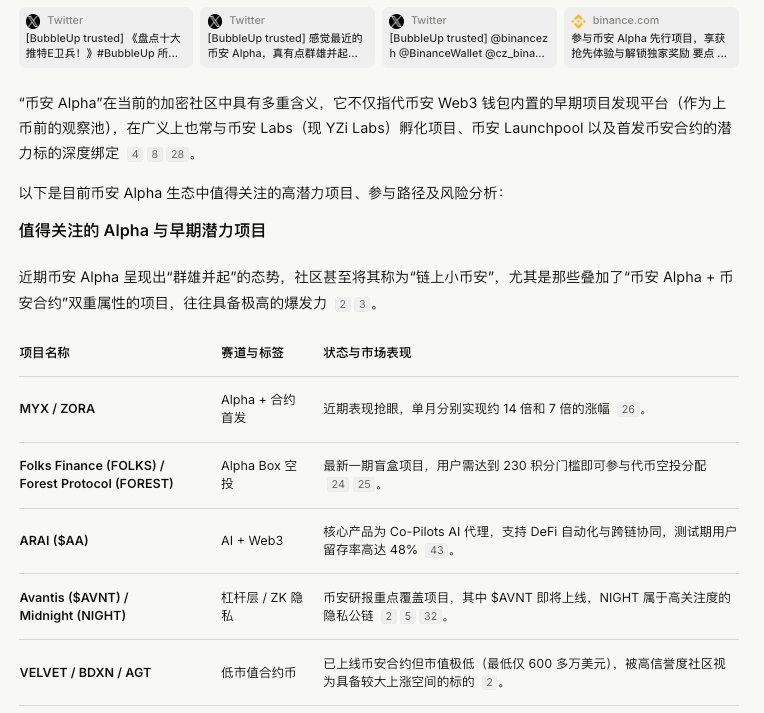
 73 109 13.71K 閱讀原文 >釋出後MYX走勢看漲xBubble_ai uses an SOP system to deeply analyze Binance Alpha projects, providing a comprehensive assessment and risk warnings.
- Kurnia Bijaksana Trader Educator C46.87K @mkbijaksana
MYX short setup https://t.co/YmijpocKH7
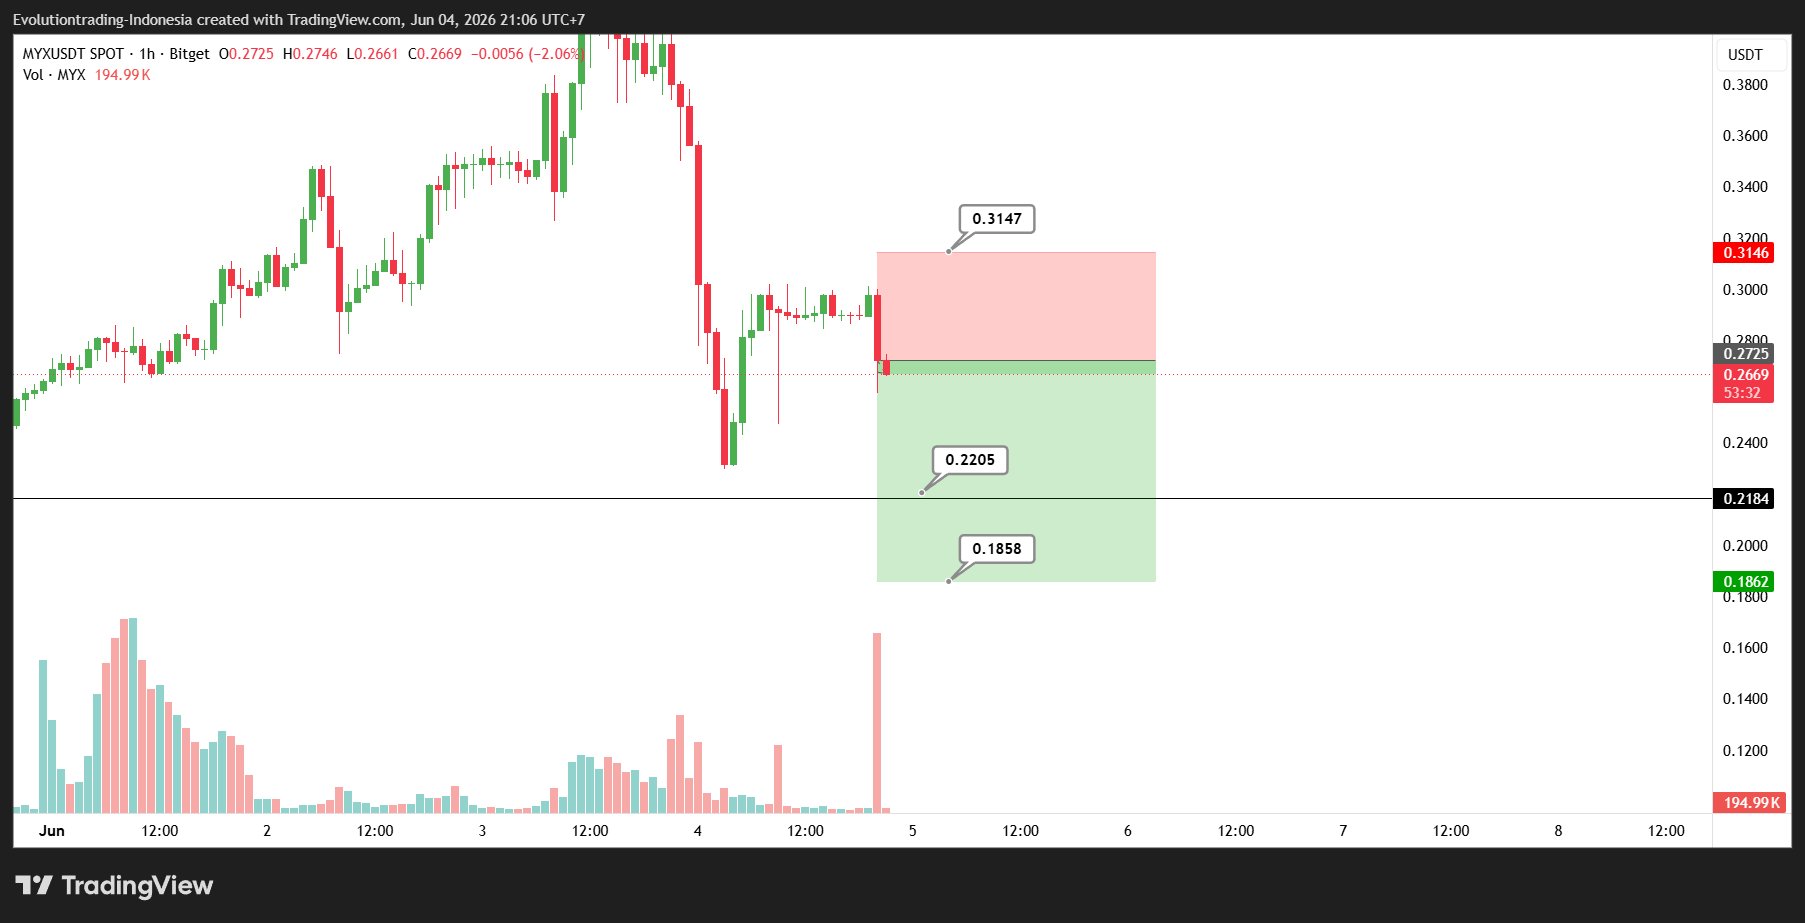 1 0 523 閱讀原文 >釋出後MYX走勢看跌The MYX/USDT chart shows a short setup, with target price levels at 0.2205 and 0.1858.
 - Kurnia Bijaksana Trader Educator C46.87K @mkbijaksana
MYX potential buy NFA https://t.co/aULhzUADpX
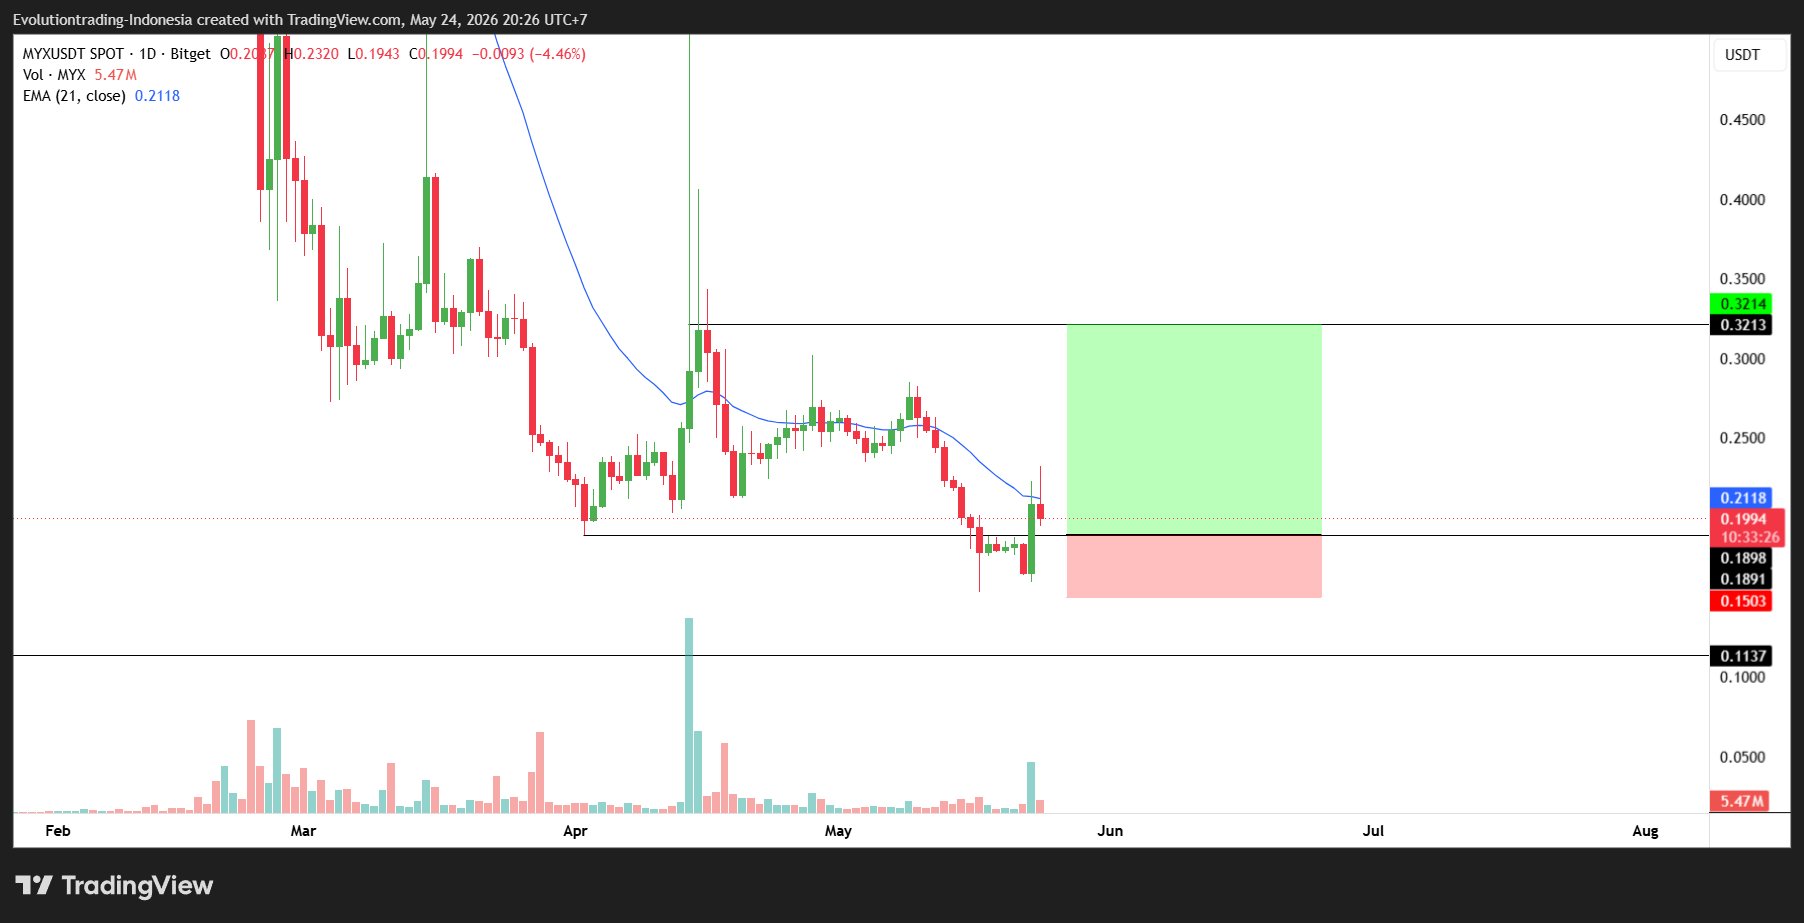 3 0 903 閱讀原文 >釋出後MYX走勢看漲MYX technical analysis shows a potential buying opportunity, target price around $0.32.
  allincrypto 熬鹰资本 🇨🇳 Trader Influencer A152.16K @thankUcrypto
Small position tries MYX Bottom reversal + top 10 gainers + hawk-watching live trade without a crash. https://t.co/DJLVHmJhwK
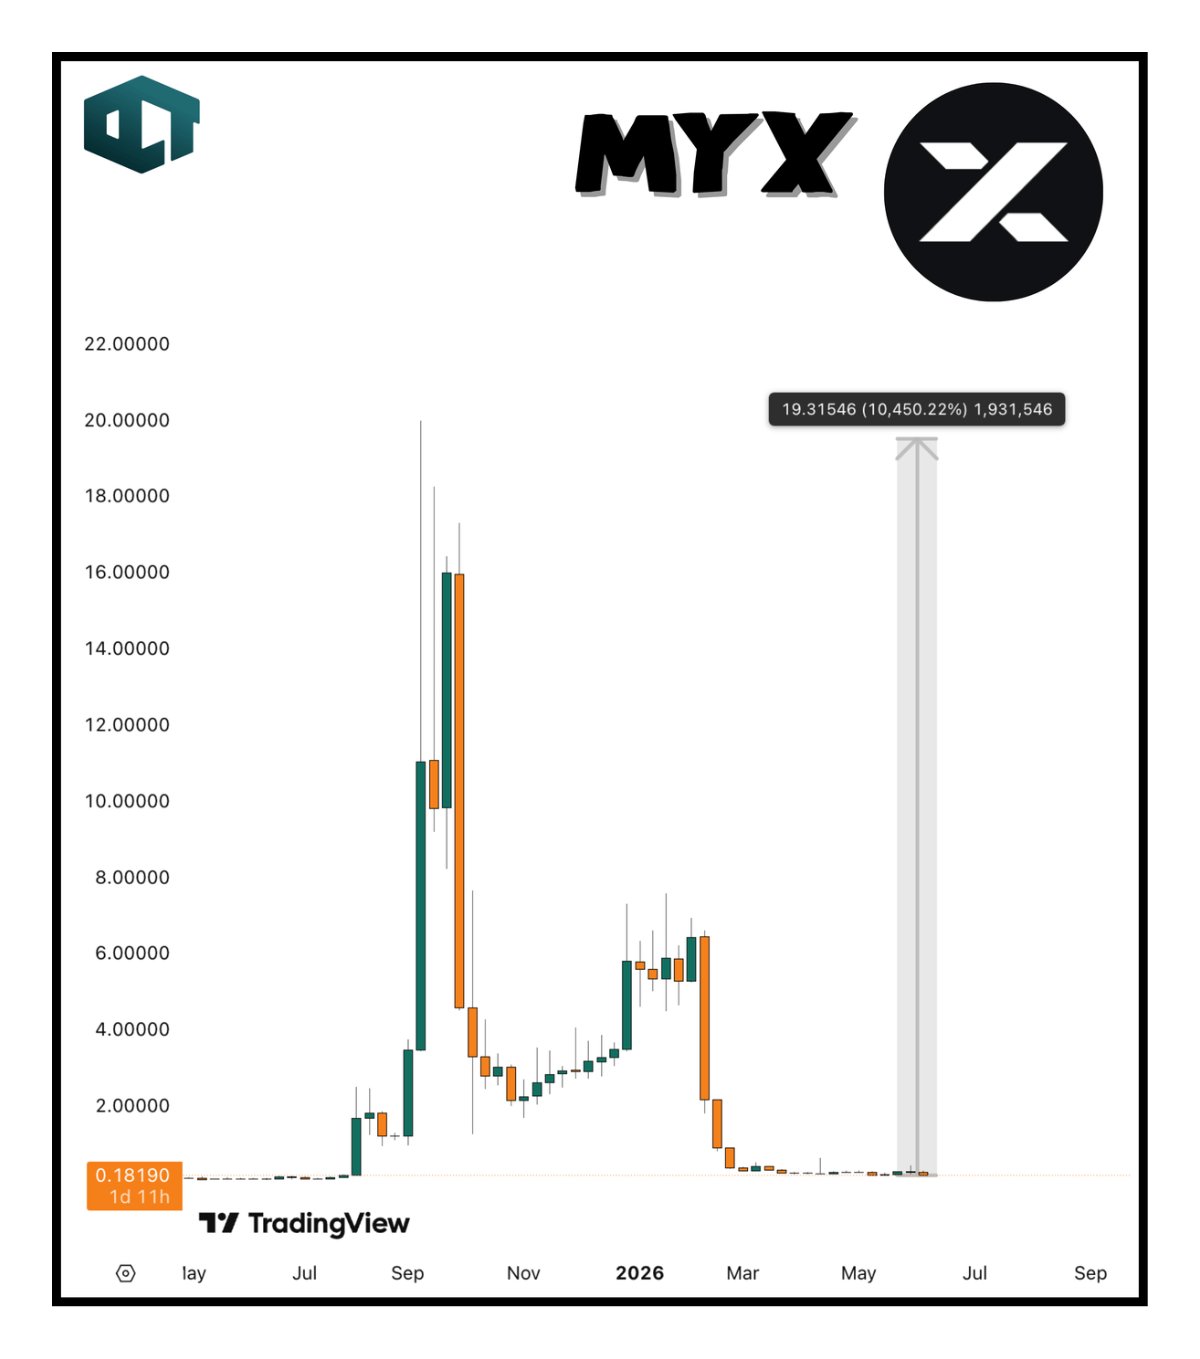
 42 58 32.46K 閱讀原文 >釋出後MYX走勢極度看漲MYX has surged recently and entered the top ten gainers, and the author’s small position has profited.
- Kurnia Bijaksana Trader Educator C46.87K @mkbijaksana
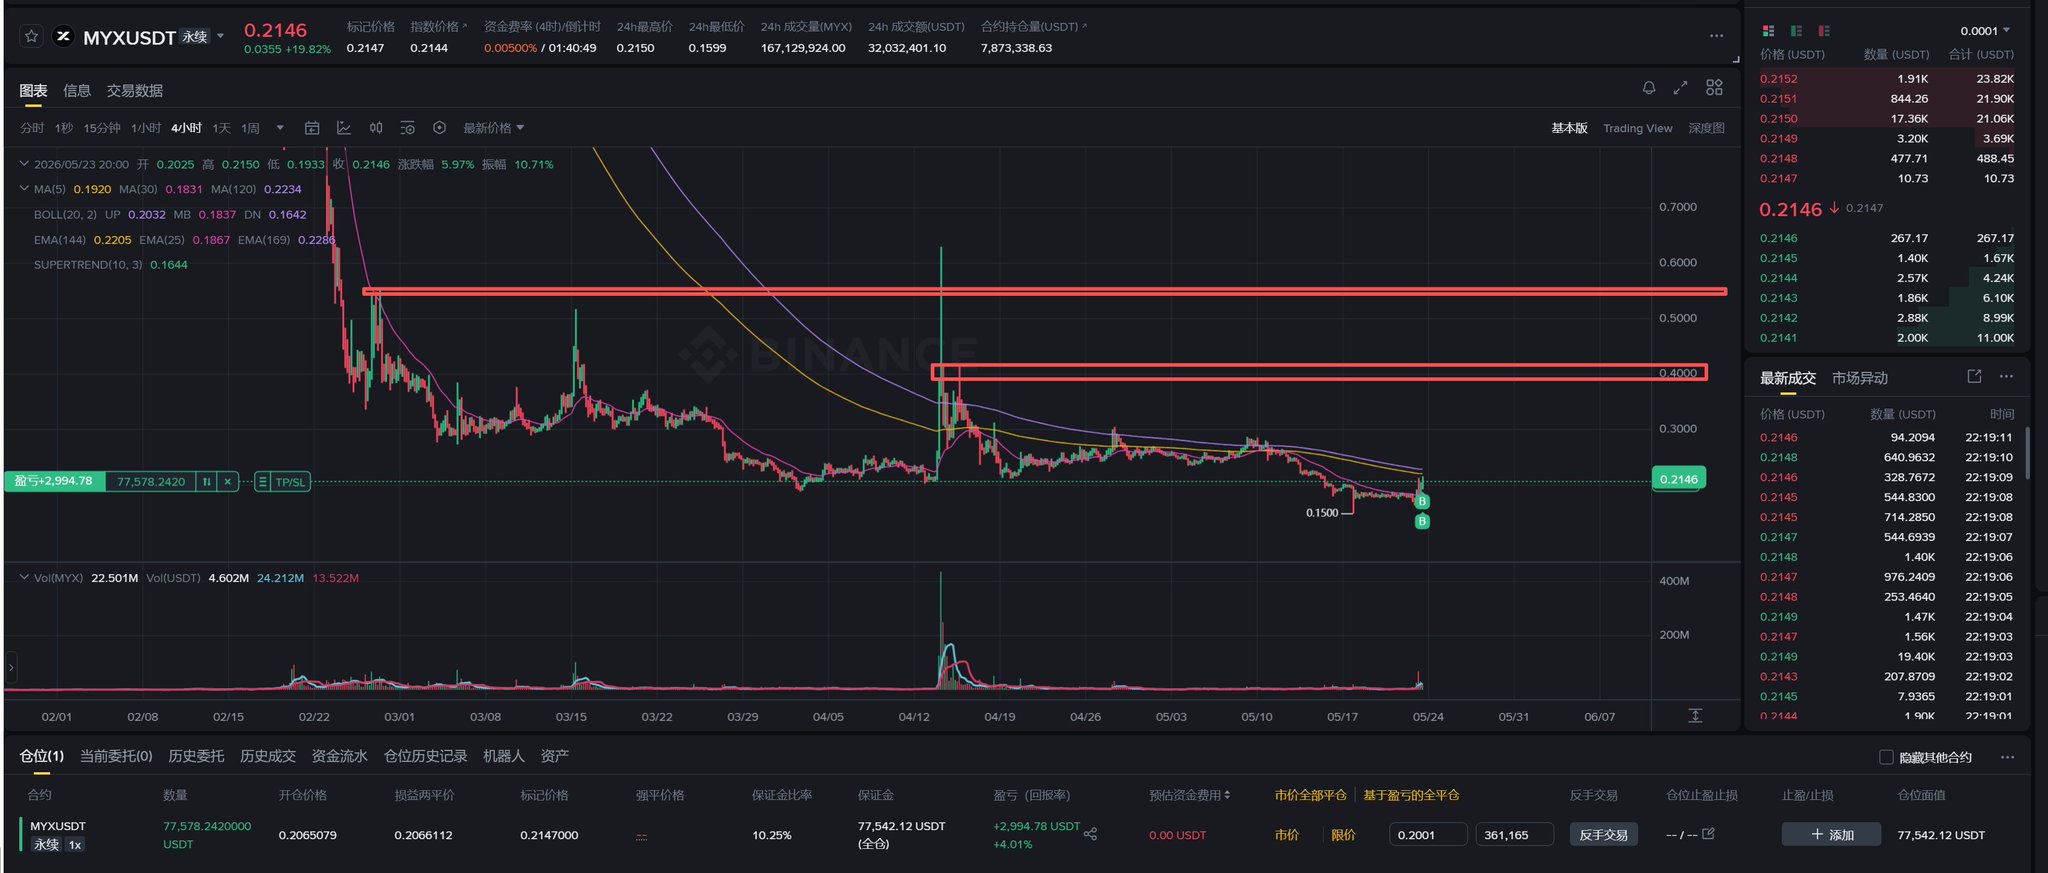
MYX Let's see if price can reclaim $0.1891 POL Waiting for breakout of POC FIDA Let's see if it can break the high in 0.02531 https://t.co/1pXnV53oBO
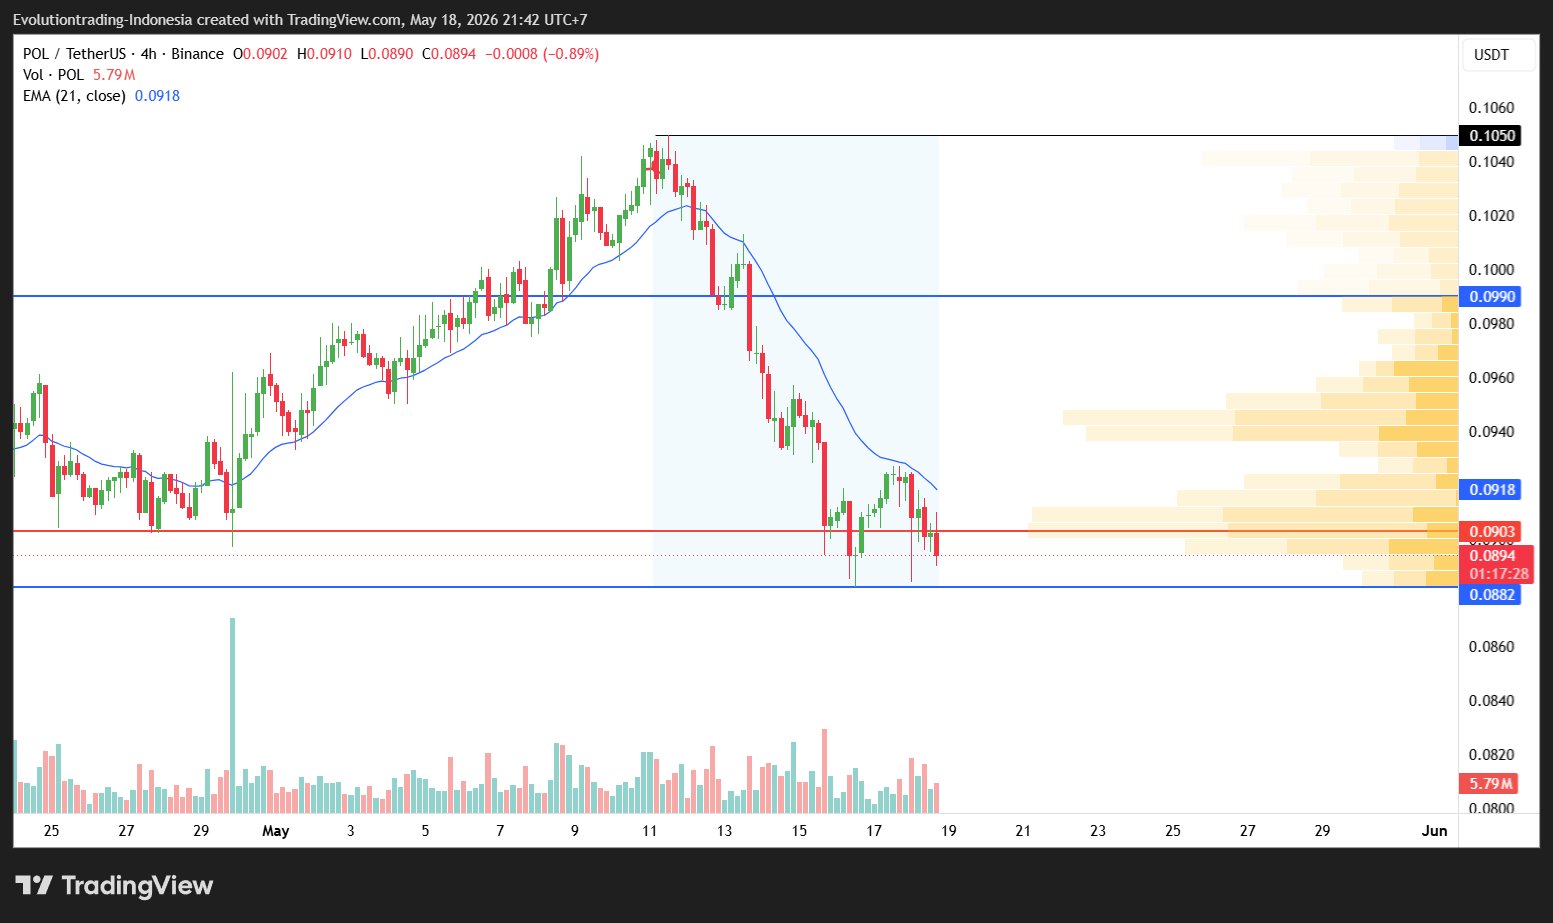
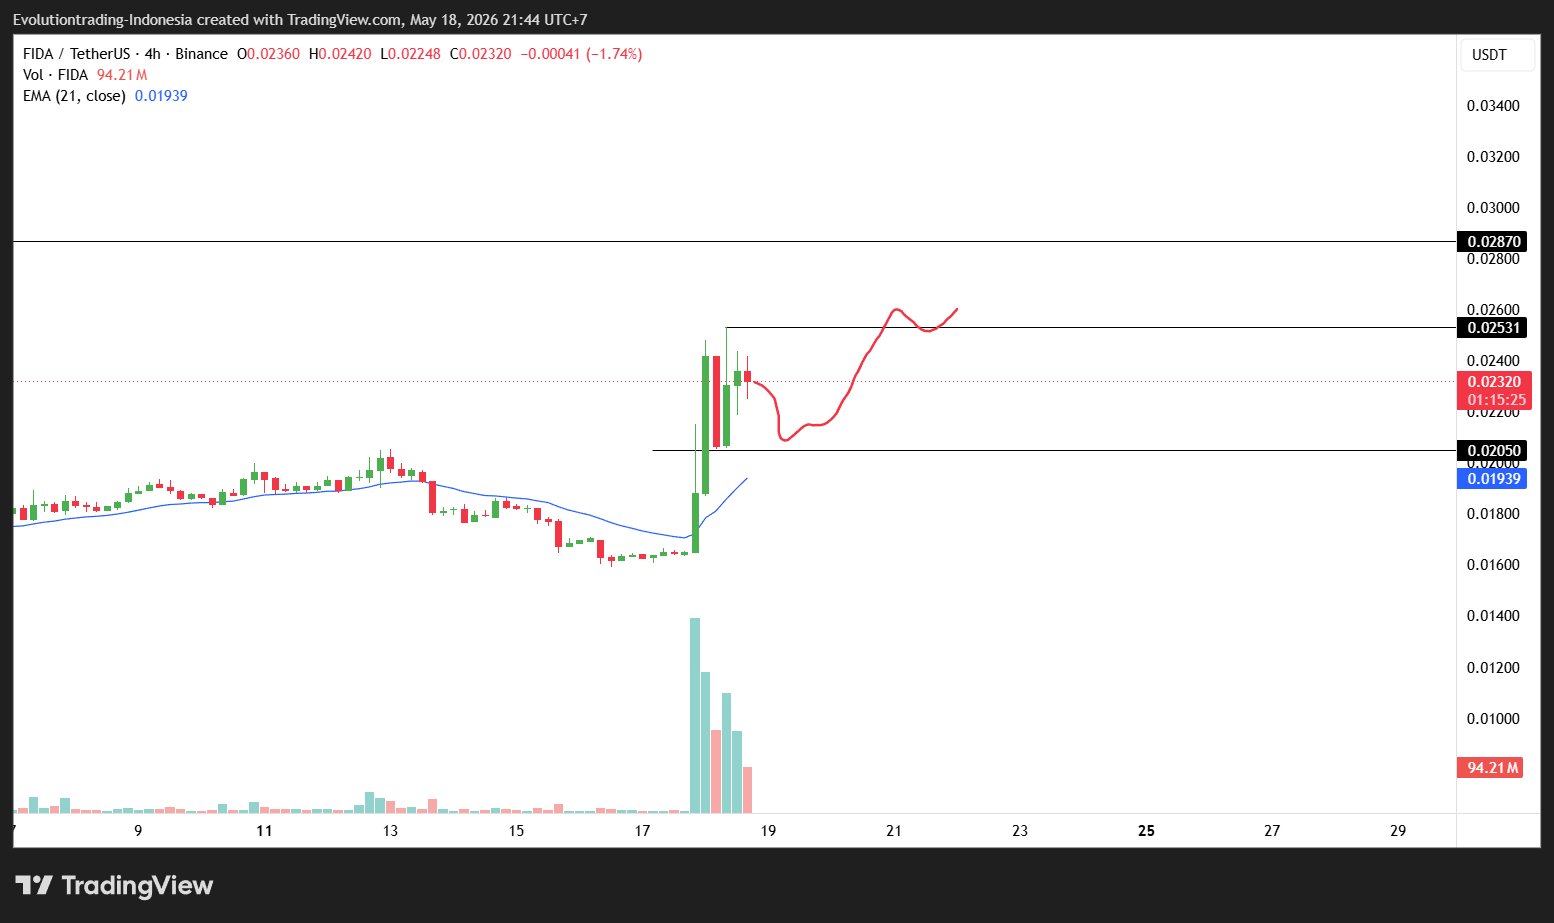
 8 0 791 閱讀原文 >釋出後MYX走勢中性MYX, POL, and FIDA are each waiting at key price levels for a breakout or rebound, and the author remains neutral.
 - Kurnia Bijaksana Trader Educator C46.87K @mkbijaksana
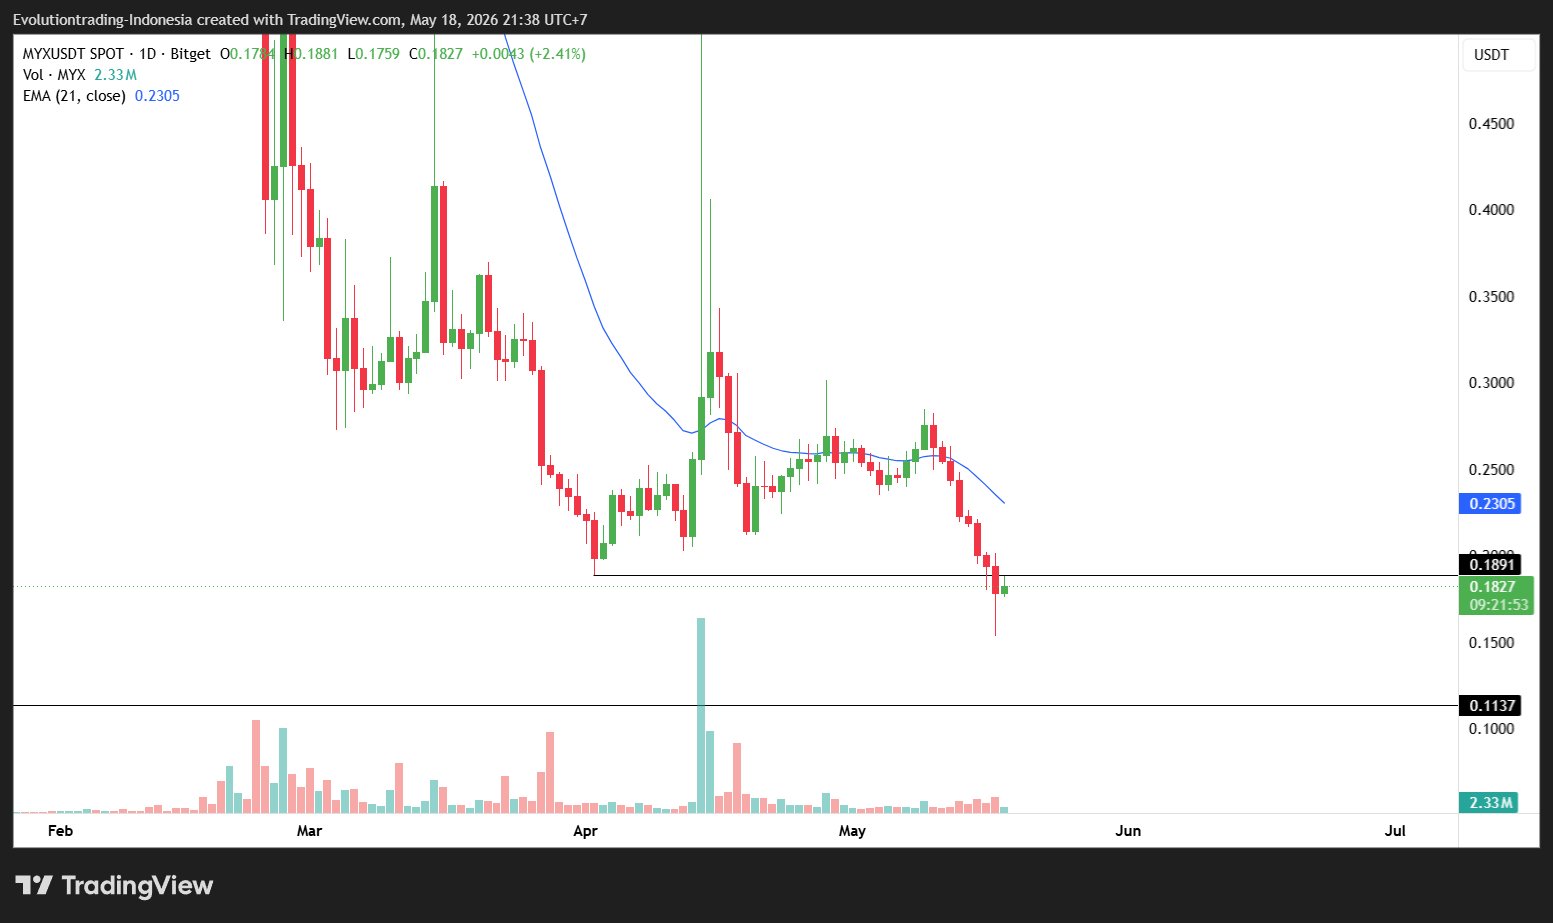
MYX fresh new low https://t.co/xR1xUcpNz1
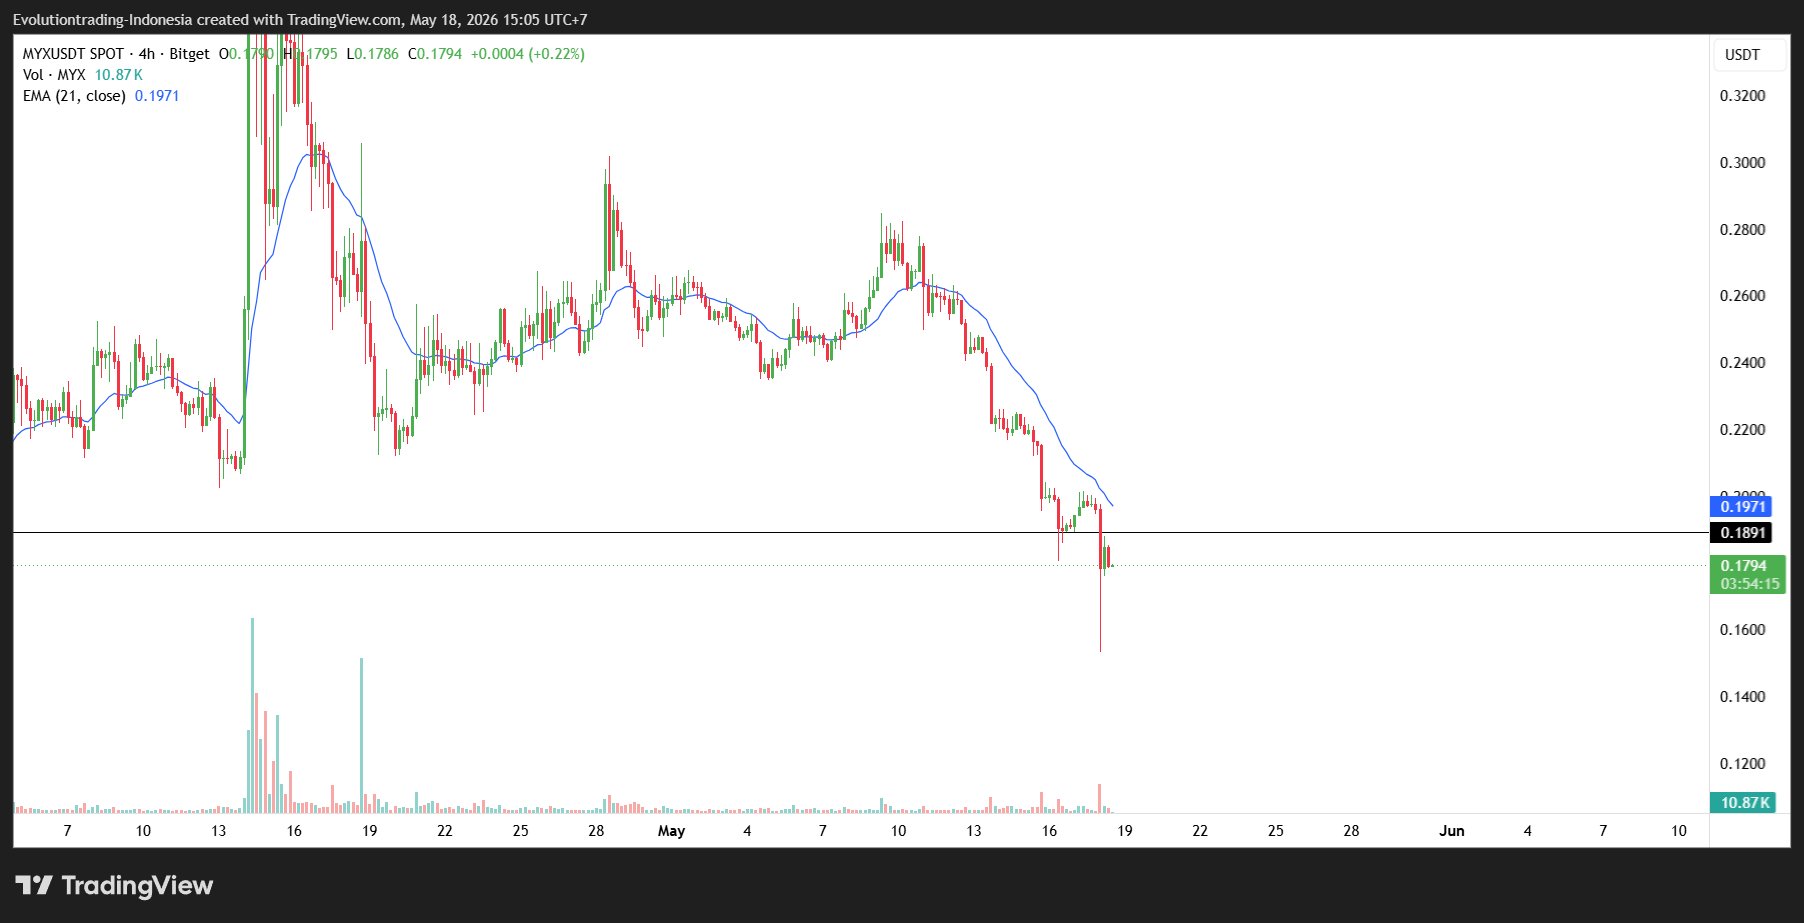 Kurnia Bijaksana Trader Educator C46.87K @mkbijaksana
ZEC: Correction potential up to 400 area MYX testing daily low CHIP: Bearish https://t.co/3HDtP9bxvT
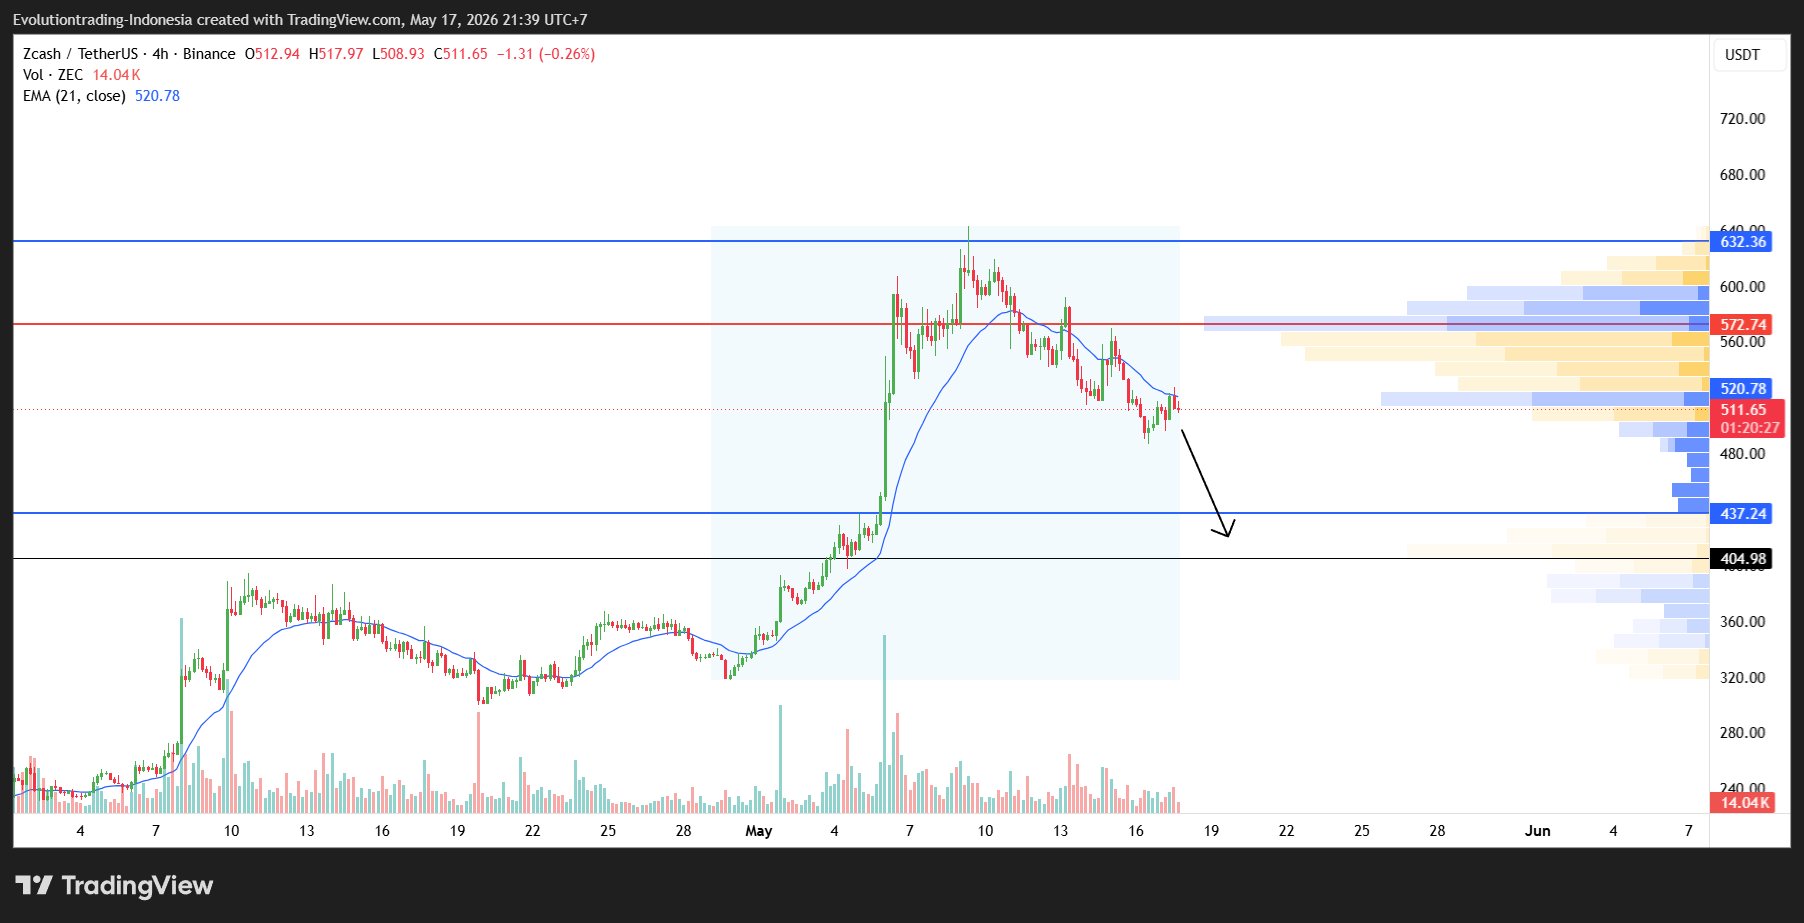
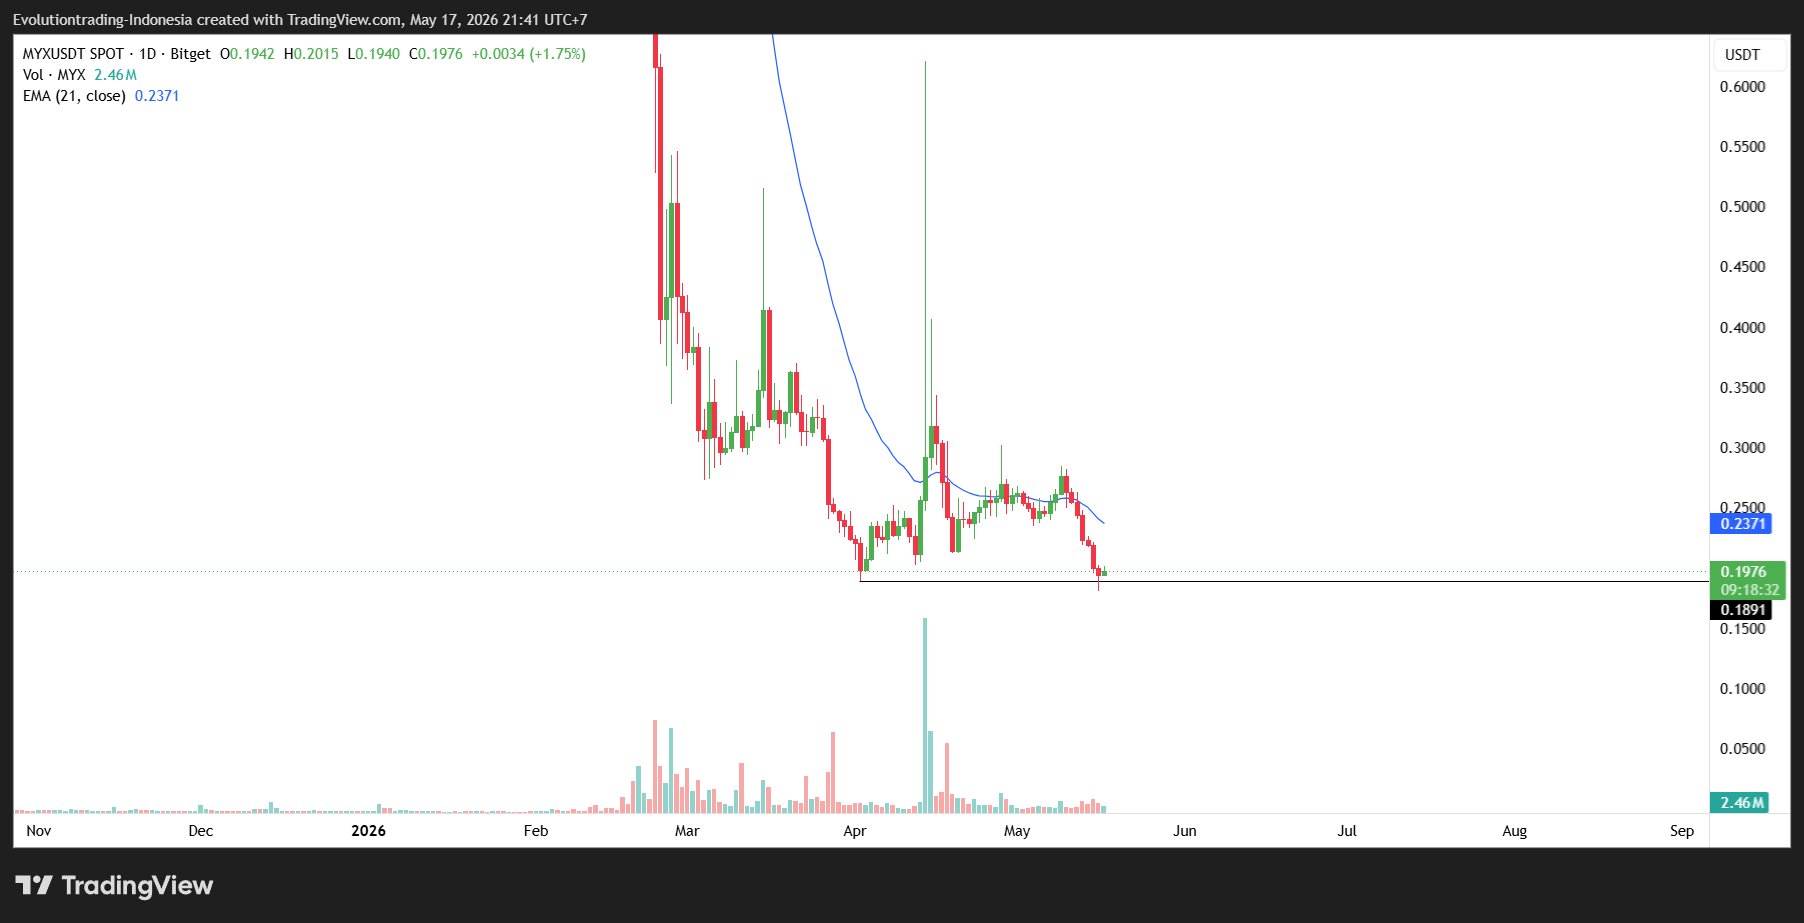
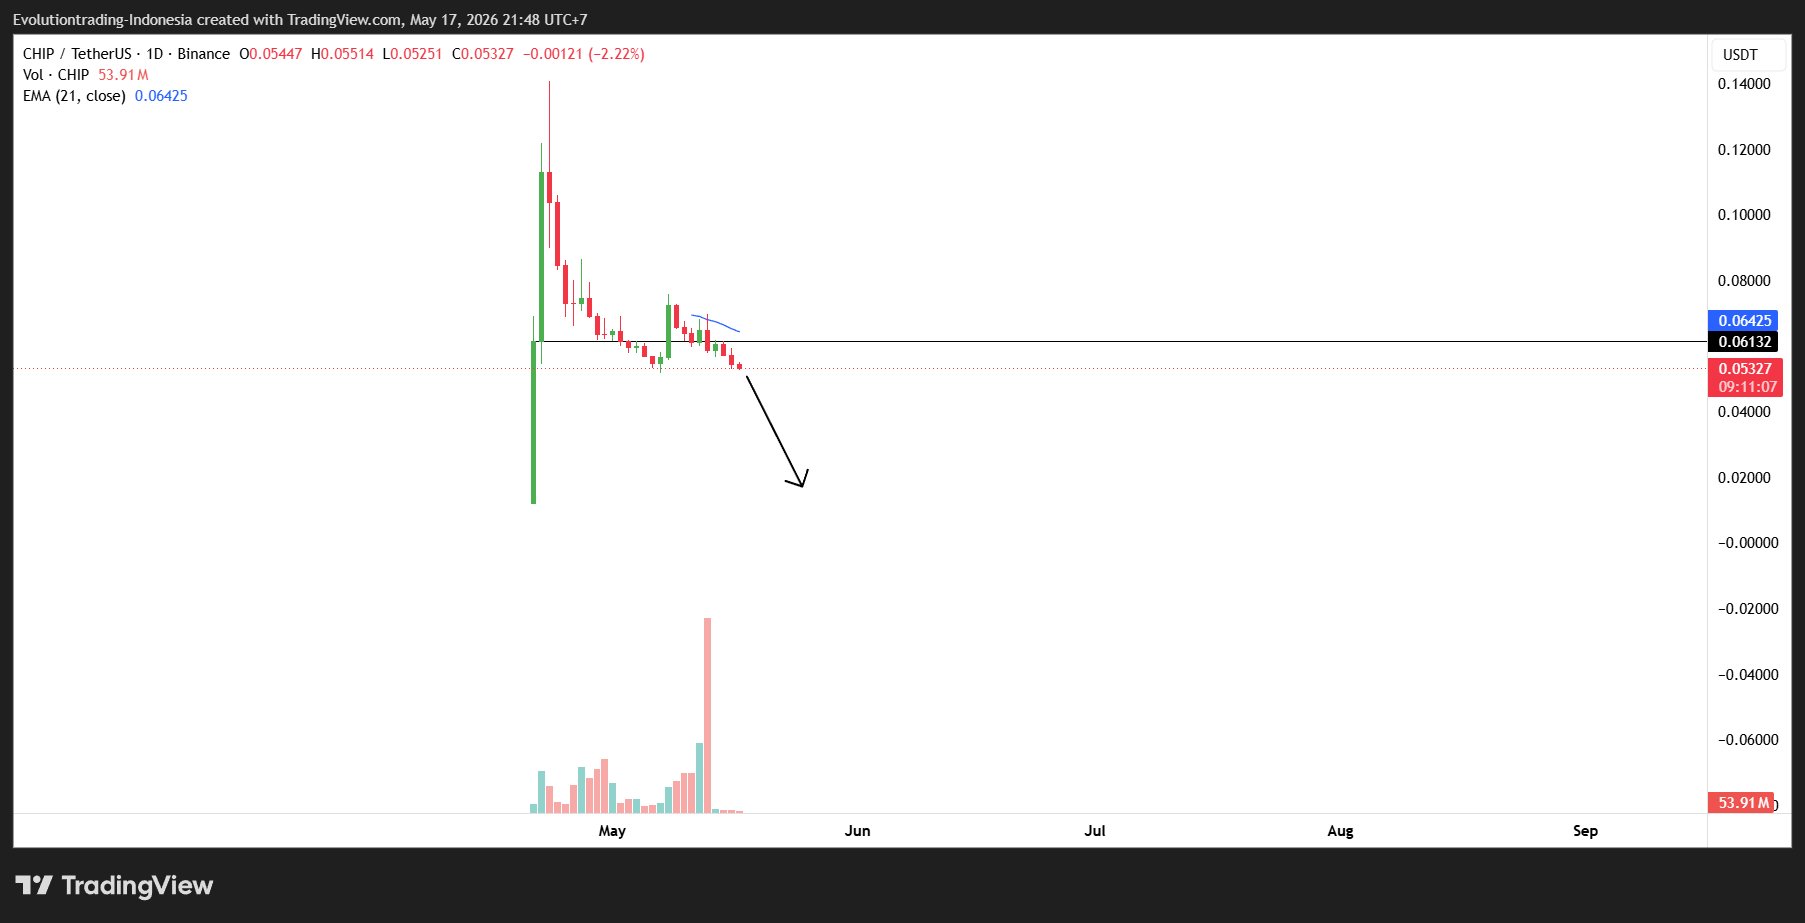 1 0 469 閱讀原文 >釋出後MYX走勢極度看跌MYX hits new low, ZEC has correction potential down to the 400 area, CHIP clearly bearish.
  小莫啊莫 OnChain_Analyst Trader A6.26K @nemoyue0607
Why do you keep losing money in the crypto world? Follow @tradinghoex to dissect the manipulation process of $myx and $coai pump‑and‑dump coins, and learn to lose less. Script 1: Perfect short squeeze, using MYX as an example This tactic is extremely insidious, targeting short sellers, and squeezes them in five stages: 1. Covert position building (late August 2025): The manipulators, like ants moving, used six wallets to execute 2,240 micro‑buys on PancakeSwap (accumulating $3.92 million) before moving the tokens to a CEX. At the same time, multiple wallets systematically deposited USDT into the liquidity pool (each deposit precisely $19,900 or varying tens of thousands of dollars), rotating operations and silently deepening the pool. 2. Bait the market (early August): The price jumped from $0.10 to $1.29 (a 1,190 % rise in five days). When 39 million tokens unlocked on August 6, the price was $1.65. This explosive rise of a tiny, little‑known token makes retail traders instinctively think “it’s too easy to short.” 3. Set the trap (August 6 – September 6): The price was pegged in a tight $1.05‑$2.00 range for a month. During this period, the funding rate was deeply negative (short sellers had to pay a –12 % rate daily). The chart looked like a clear top, luring massive short positions to rush in. 4. Violent squeeze (September 7 – 10): The trap is revealed! On September 7, open interest (OI) surged and the price instantly doubled from $1.31 to $3.39. On September 8 it surged further to $14.09. According to WEEX data, a single day saw $16.53 million of liquidations (including $13.68 million of short positions). Forced buy‑backs triggered a cascade of liquidations, OI jumped past $370 million, and daily trading volume was inflated to $9‑10 billion. 5. Exit strategy: After the price peaked, the manipulators turned to shorting and began large deposits to the CEX. Retail veterans saw the transfers and thought a dump was coming, so they shorted? Sorry, the manipulators squeezed this fresh wave of shorts once more before the actual dump, then cashed out. Script 2: Simple and brutal “pump‑and‑dump” (using COAI as an example) Unlike MYX’s psychological warfare, COAI emphasizes “speed is the ultimate weapon”: COAI launched in September 2025 at $0.22; after a week of consolidation, it listed on Aster on October 6 with 5× leverage, soaring from $0.39 to $2.42 in a single day. Key data: On‑chain data shows 60 highly coordinated bot wallets that, on March 25 2025 at 11:00 UTC, received exactly 1 BNB of seed capital in the same second and executed synchronized purchases on the DEX. Because only 24.86 % was unlocked at TGE (extremely low circulation), the manipulators used the “BNB Season” and “AI” narrative as cover; without needing to force a short squeeze, a few million dollars were enough to fully control the market, pushing the price to an internal ATH of $44‑45 within days, then dumping it, causing OI to plunge sharply. These tokens share astonishing common traits: • Extremely low circulating supply: MYX unlocked only 9.21% at launch, COAI only 19.65%. On paper 20% appears to circulate, but in reality 95% is held by manipulators; without low‑float, the act cannot continue. • Everything can be an AI narrative: most projects on the list (e.g., AIA, Rave) brand themselves as AI Agent infrastructure. • Sequential token launch scheme: BNB Chain > Binance Alpha > Binance Futures. Listing futures is a killer move because leverage enables market makers to create liquidation waterfalls. Multi‑chain deployment also lets manipulators exploit cross‑chain bridges (e.g., Ronin Bridge pause) and weak liquidity for arbitrage manipulation. Practical section: How to see through the micro‑lies of the order book? Knowing the script isn’t enough; you need practical tools to catch manipulators, focusing on these core indicators and methodologies: 1. Spot “volume brushing” (OI Brushing) Typical tokens have a volume/OI ratio of 3‑8×. During MYX’s squeeze, this ratio reached a terrifying 24×! Moreover, analysis shows that two‑thirds of MYX’s volume was concentrated on Bitget. Such an abnormal share on a single exchange is likely fabricated by the manipulators to create false hype. 2. Capture TWAP (Time‑Weighted Average Price) iceberg accumulation Intelligent manipulators never place huge orders. They slowly consume sell orders near market price. You won’t see large orders, but you will notice: • Sell‑side depth continuously thinning. • Buy‑sell imbalance remaining above 0.4 for extended periods (formula: (Buy‑Volume‑Sell‑Volume)/(Buy+Sell)). This means buy orders dominate ~70% of the book for a long time; manipulators proportionally add buy orders, nudging the buy‑sell ratio from 0.95 to 0.99, appearing normal while they voraciously accumulate tokens! Geek tactic: run a Python script every 60 seconds to fetch Binance futures depth and store it in SQLite, enabling monitoring of such anomalies. 4. Cross‑exchange manipulation Binance’s mark price (which determines liquidation) is a weighted average across multiple exchanges. Manipulators can, with minimal capital, push the price on shallow second‑tier venues like Aster or Bitunix, raising Binance’s mark price to trigger liquidations, and even execute delta‑neutral hedges (long on Binance, short on Aster). When a token has no spot activity but appears on both second‑tier and Binance futures, it should be blacklisted! Five fatal signals: 1. Funding rate: Persistent negative = plenty of “fuel,” short squeeze continues; moving toward zero = shorts capitulate, squeeze ending; flipping positive = shorts wiped out, longs start paying, likely a downtrend. 2. OI vs price: both rising = new shorts walking into a death trap; OI falling while price stable = liquidation buying weakening; price falling while OI rises = manipulators have turned short. 3. Taker Ratio: buyer‑dominated = short squeeze ongoing, balance = about to end; seller‑dominated for many hours = manipulators distributing remaining tokens to the last buyers. 4. Large on‑chain transfers: during a short squeeze there are no big transfers. Once a large wallet starts moving massive funds to a CEX, expect an imminent dump. Toolbox: • CoinAnk: the ultimate radar for cross‑exchange OI distribution, funding rates, and liquidation data (best single dashboard). • Arkham & Bubblemaps: investigate on‑chain front‑running and wallet clusters. • Coinglass: essential for daily OI and volume monitoring. In this heavily manipulated dark forest, our only advantage is to understand the script beforehand and use tools to anticipate the manipulators’ moves.
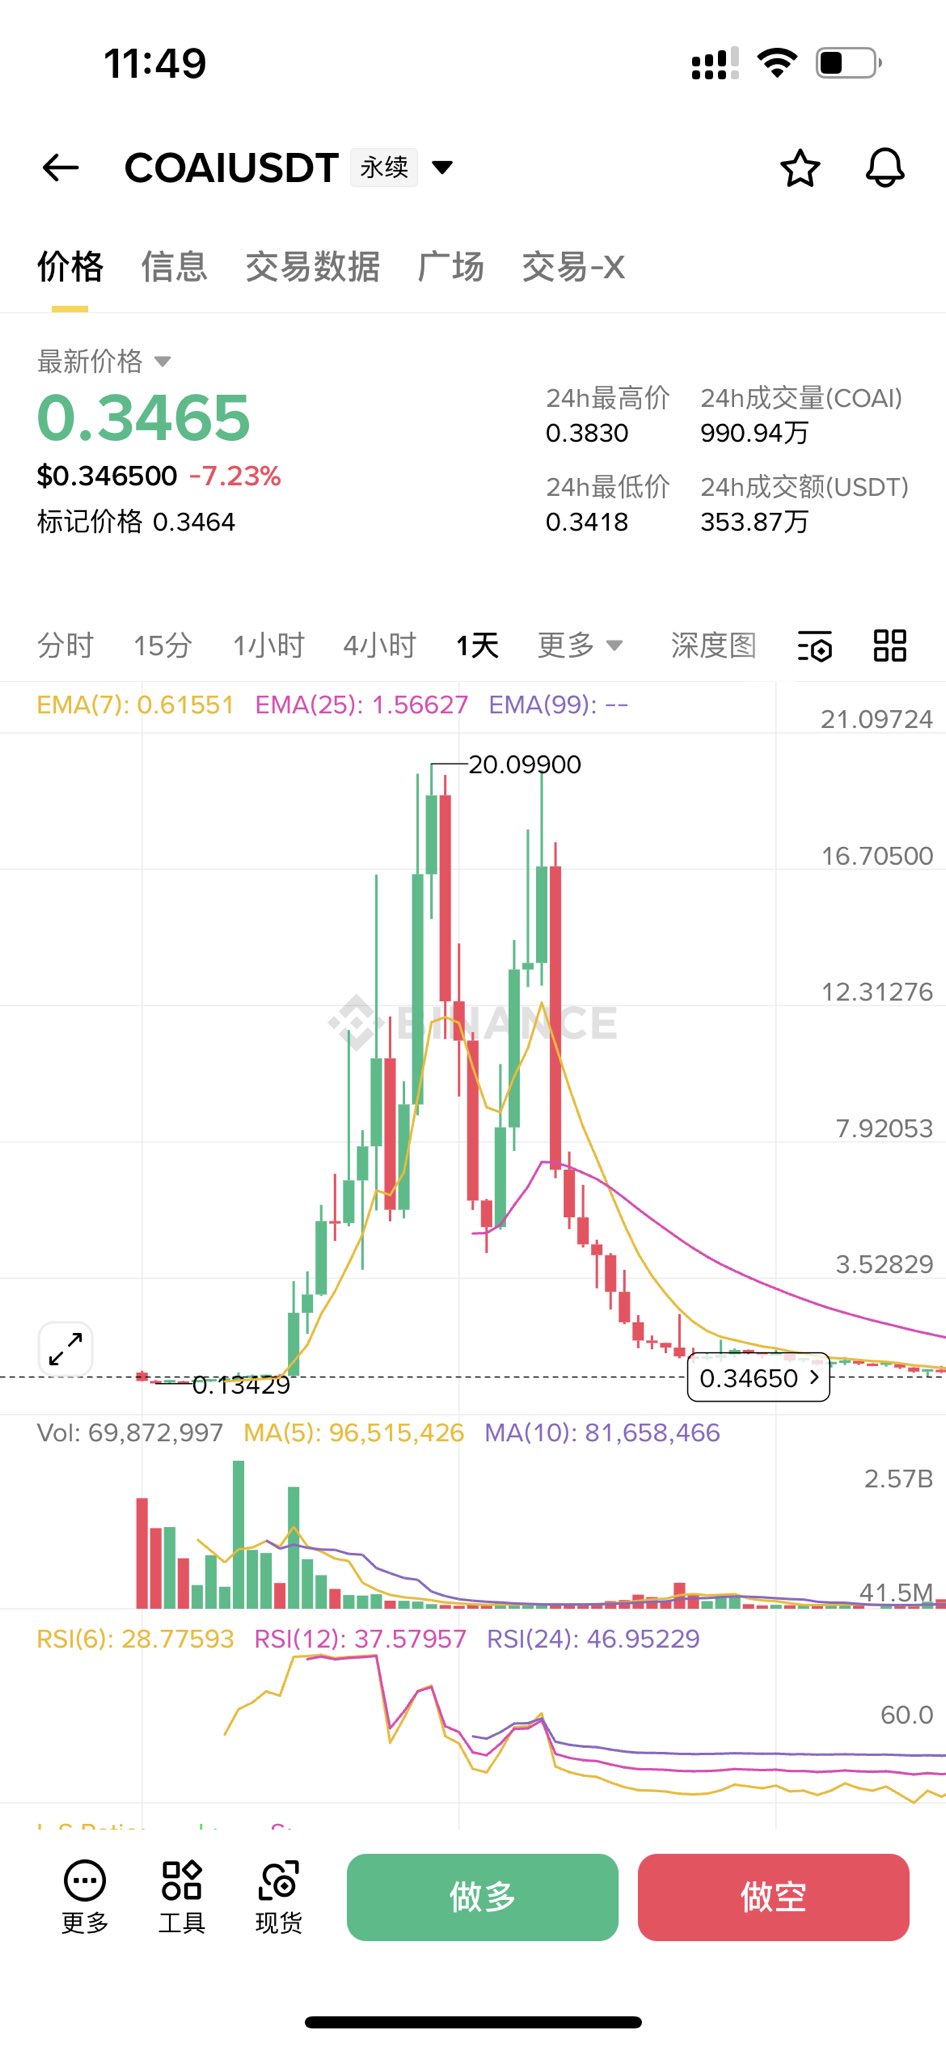
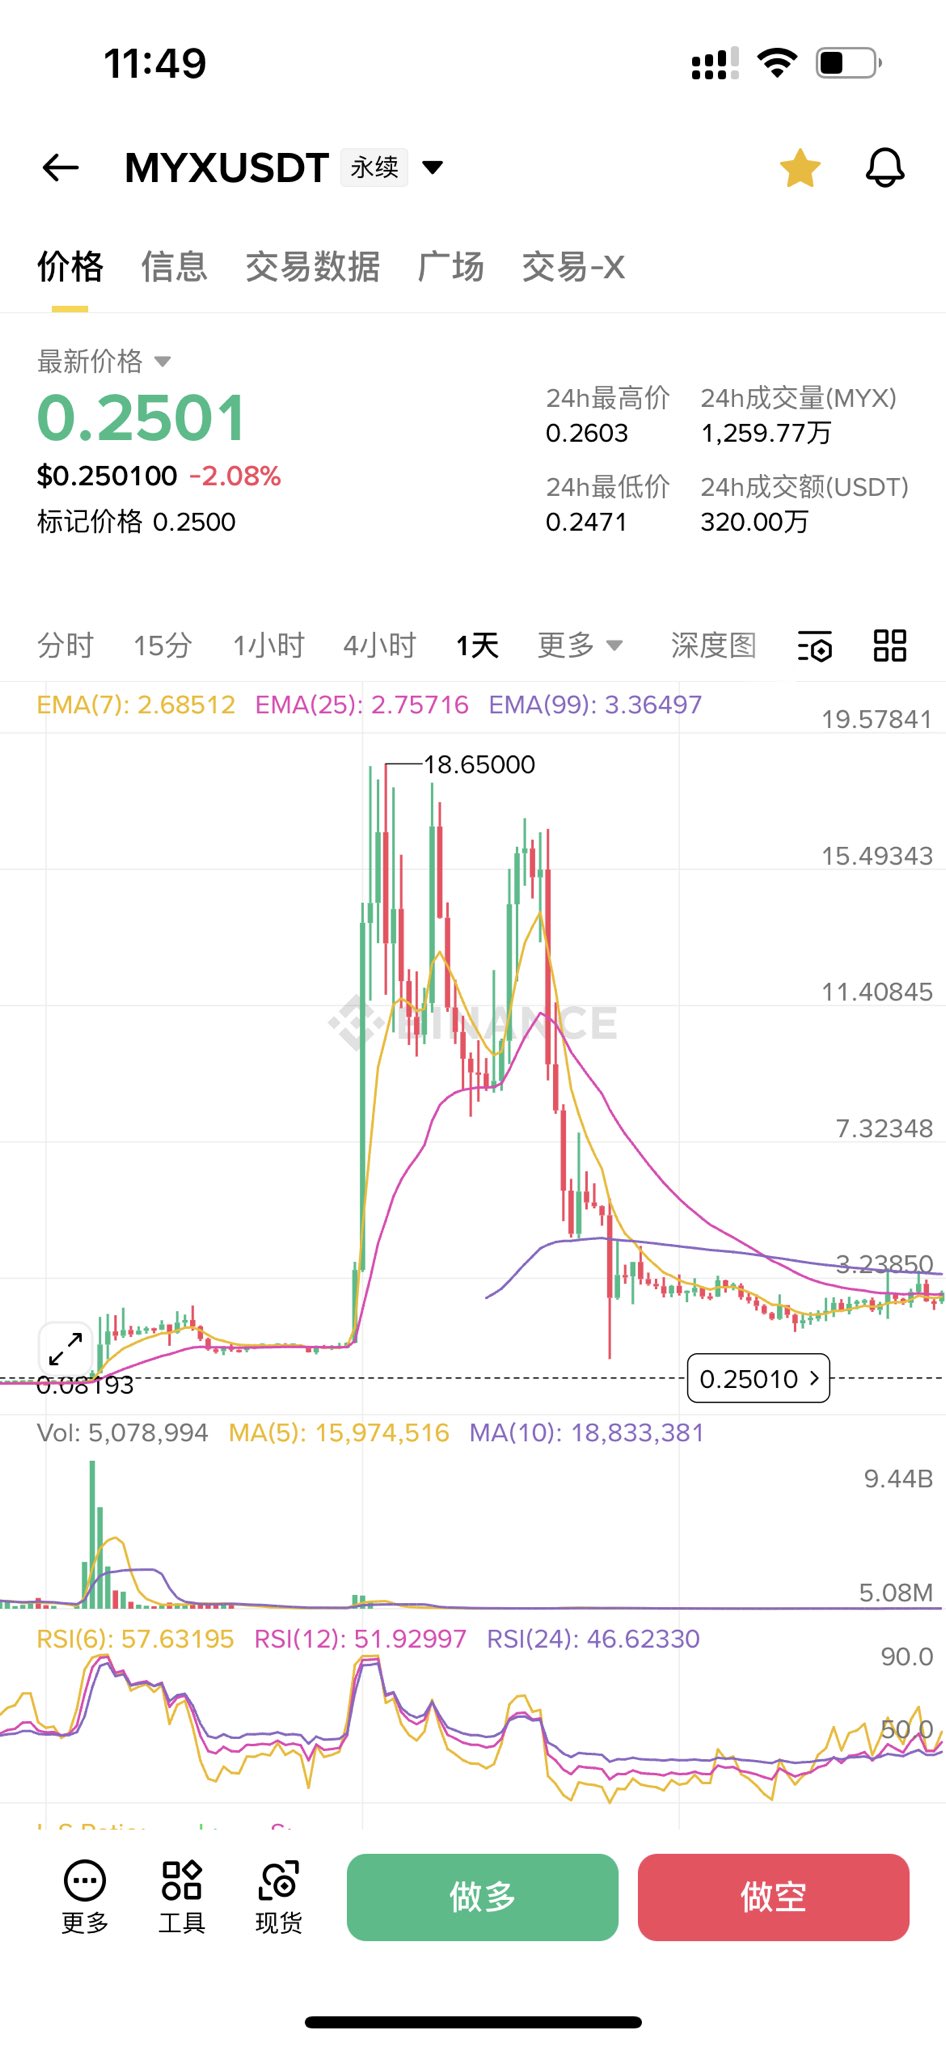 148 8 15.90K 閱讀原文 >釋出後MYX走勢看跌The tweet reveals that manipulators squeeze shorts and execute pump‑and‑dump schemes to control MYX and COAI, warning retail investors of the risk.