 Bitcoin Cash (BCH)
$213.43 -2.53% 24H
- 31社交熱度指數(SSI)-22.35% (24h)
- #147市場預警排名(MPR)-17
- 124小時社交提及量-50.00% (24h)
- 0%24小時KOL看好比例1位活躍KOL
- 概要
- 看漲訊號
- 看跌訊號
社交熱度指數(SSI)
- 總體資料31SSI
- 社交熱度趨勢(7D)價格(7D)情緒分佈中性 (100%)社交熱度洞察
市場預警排名(MPR)
- 預警解讀
相關推文
- 釋出後BCH走勢中性
 CryptoAvon2626❤️🔥 TA_Analyst Trader A2.57K @CryptoAvon2626
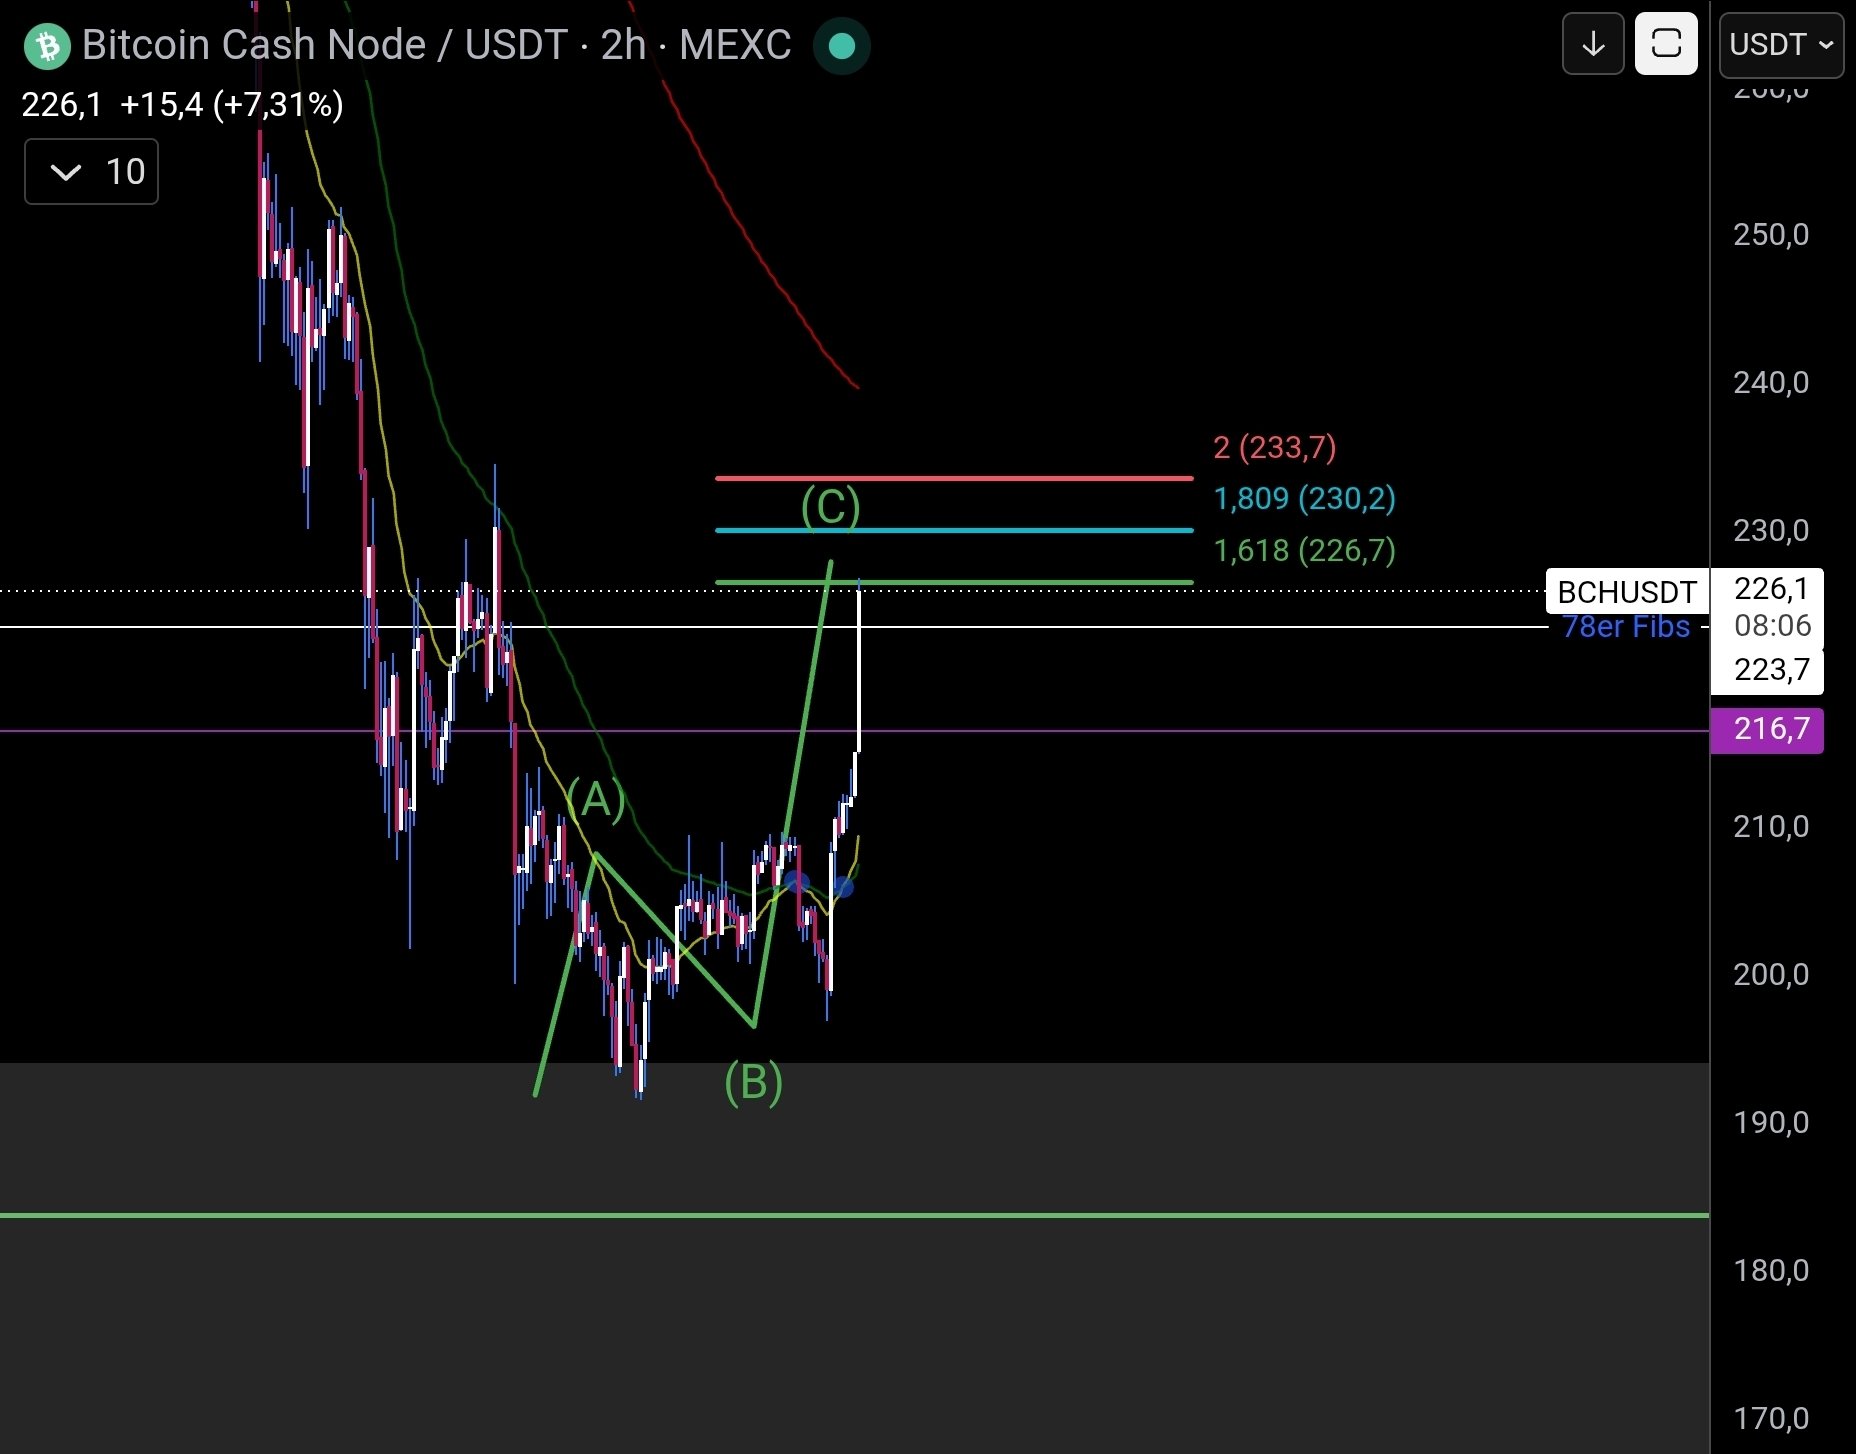
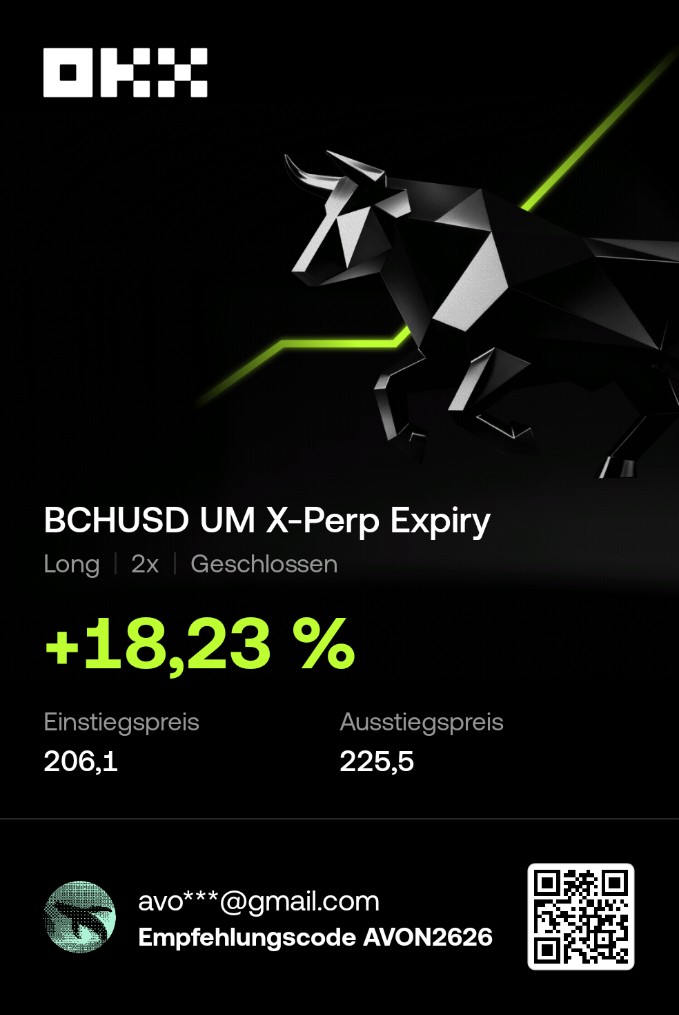 CryptoAvon2626❤️🔥 TA_Analyst Trader A2.57K @CryptoAvon2626
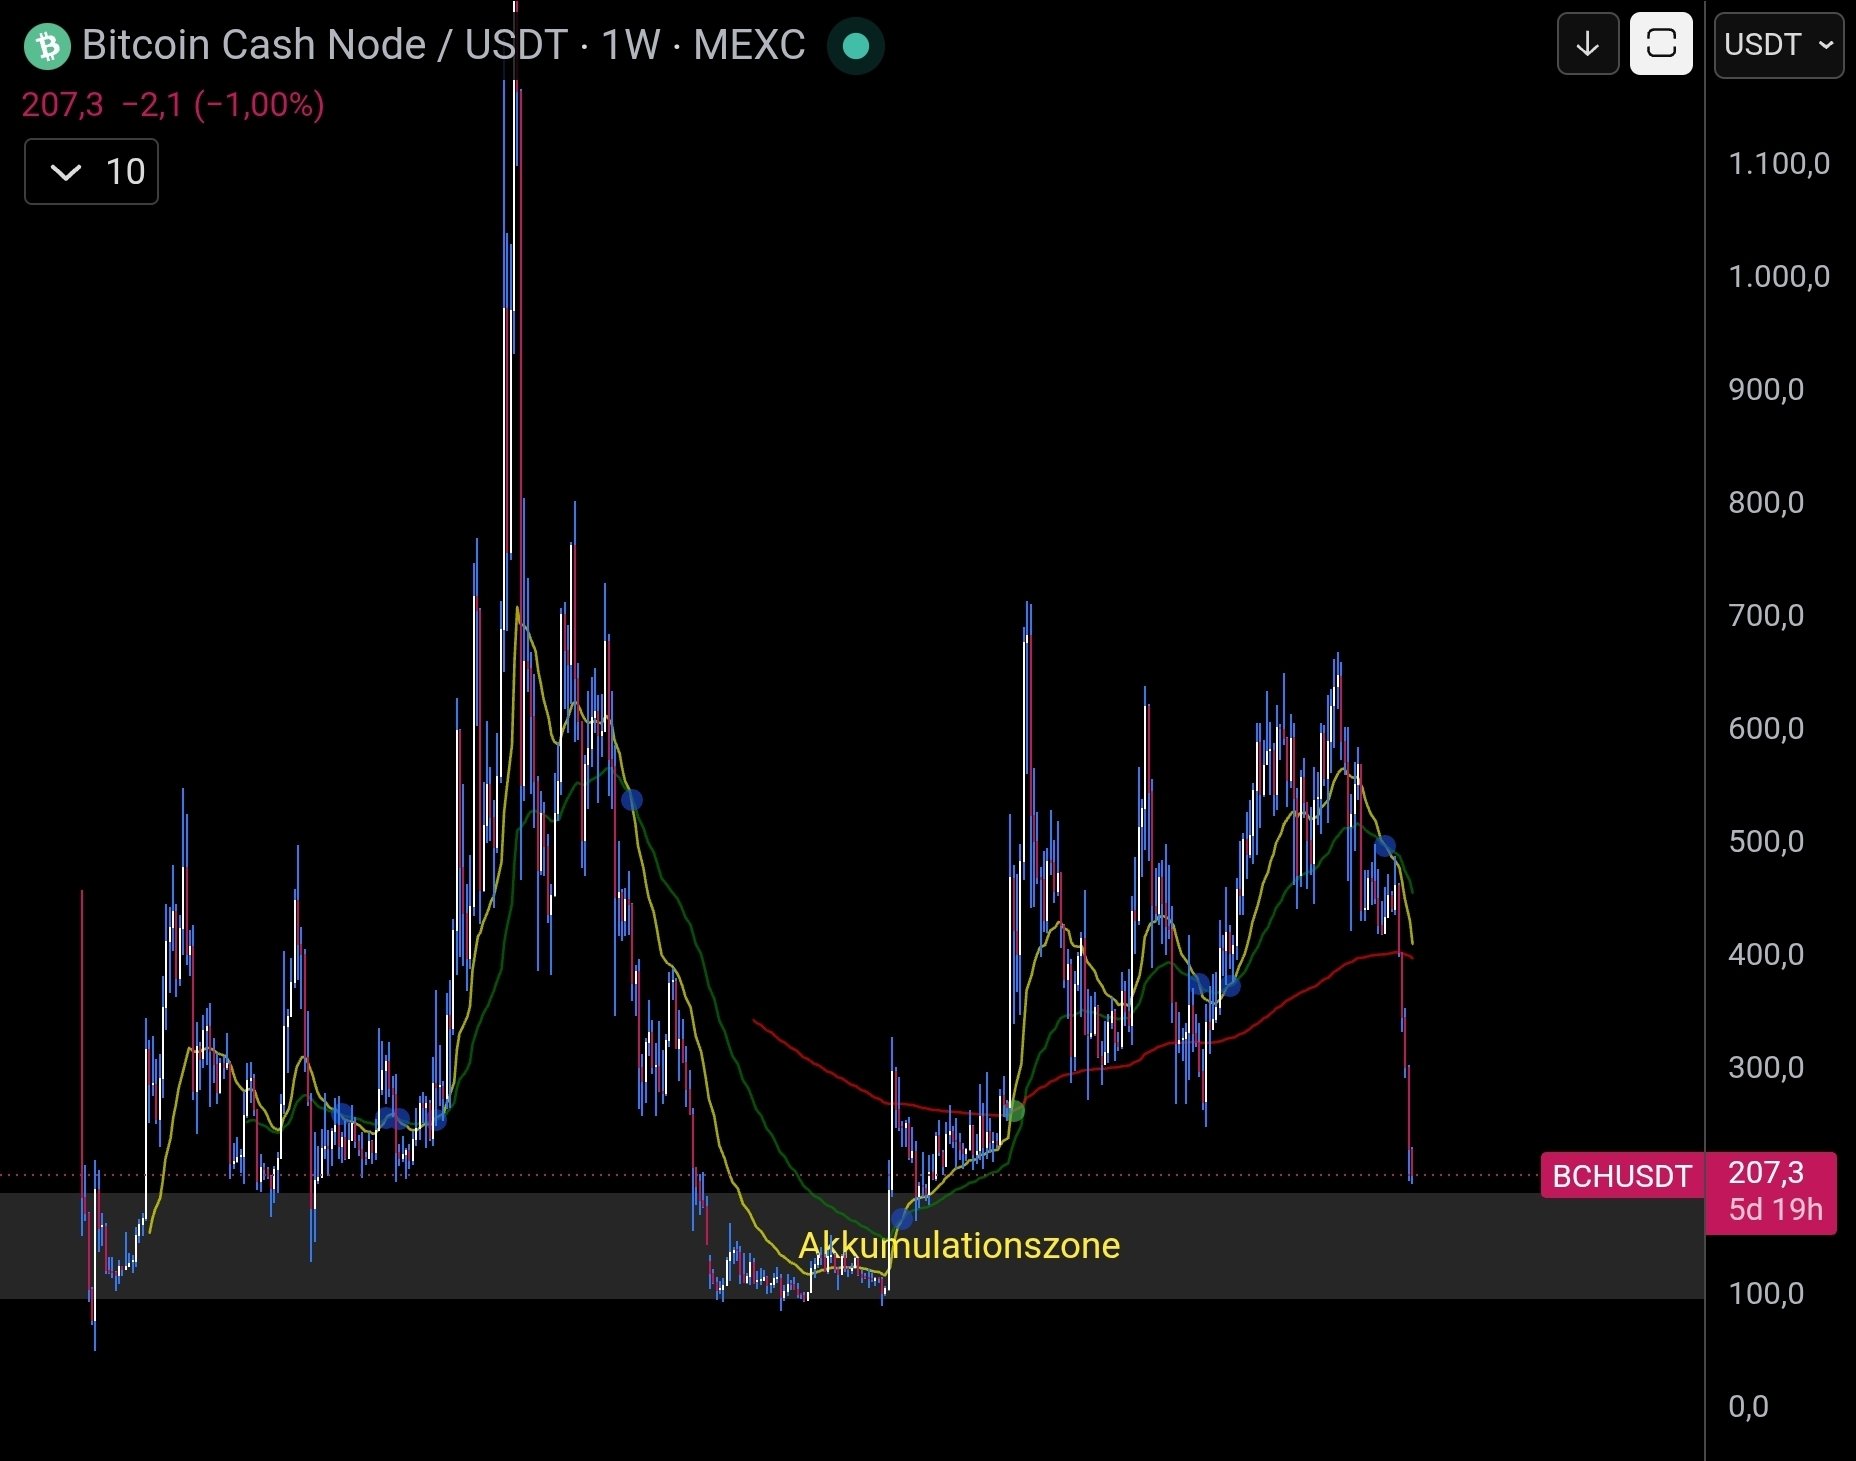 8 1 899 閱讀原文 >釋出後BCH走勢極度看漲
- 釋出後BCH走勢看漲
- 釋出後BCH走勢極度看跌
- 釋出後BCH走勢極度看跌
 Rumblo Media Influencer B6.95K @Rumblestripss
 VLAD HOSTS THE BEST PODCAST IN BITCOIN D24.93K @Vladcostea38 5 1.17K 閱讀原文 >釋出後BCH走勢中性
 Bitcoin Takeover (BTCTKVR.com) Educator Media C4.16K @BTCTKVRBitcoin Takeover (BTCTKVR.com) Educator Media C4.16K @BTCTKVR
 19 2 3.01K 閱讀原文 >釋出後BCH走勢看漲
 Erik Trader TA_Analyst C13.84K @ero_crypto
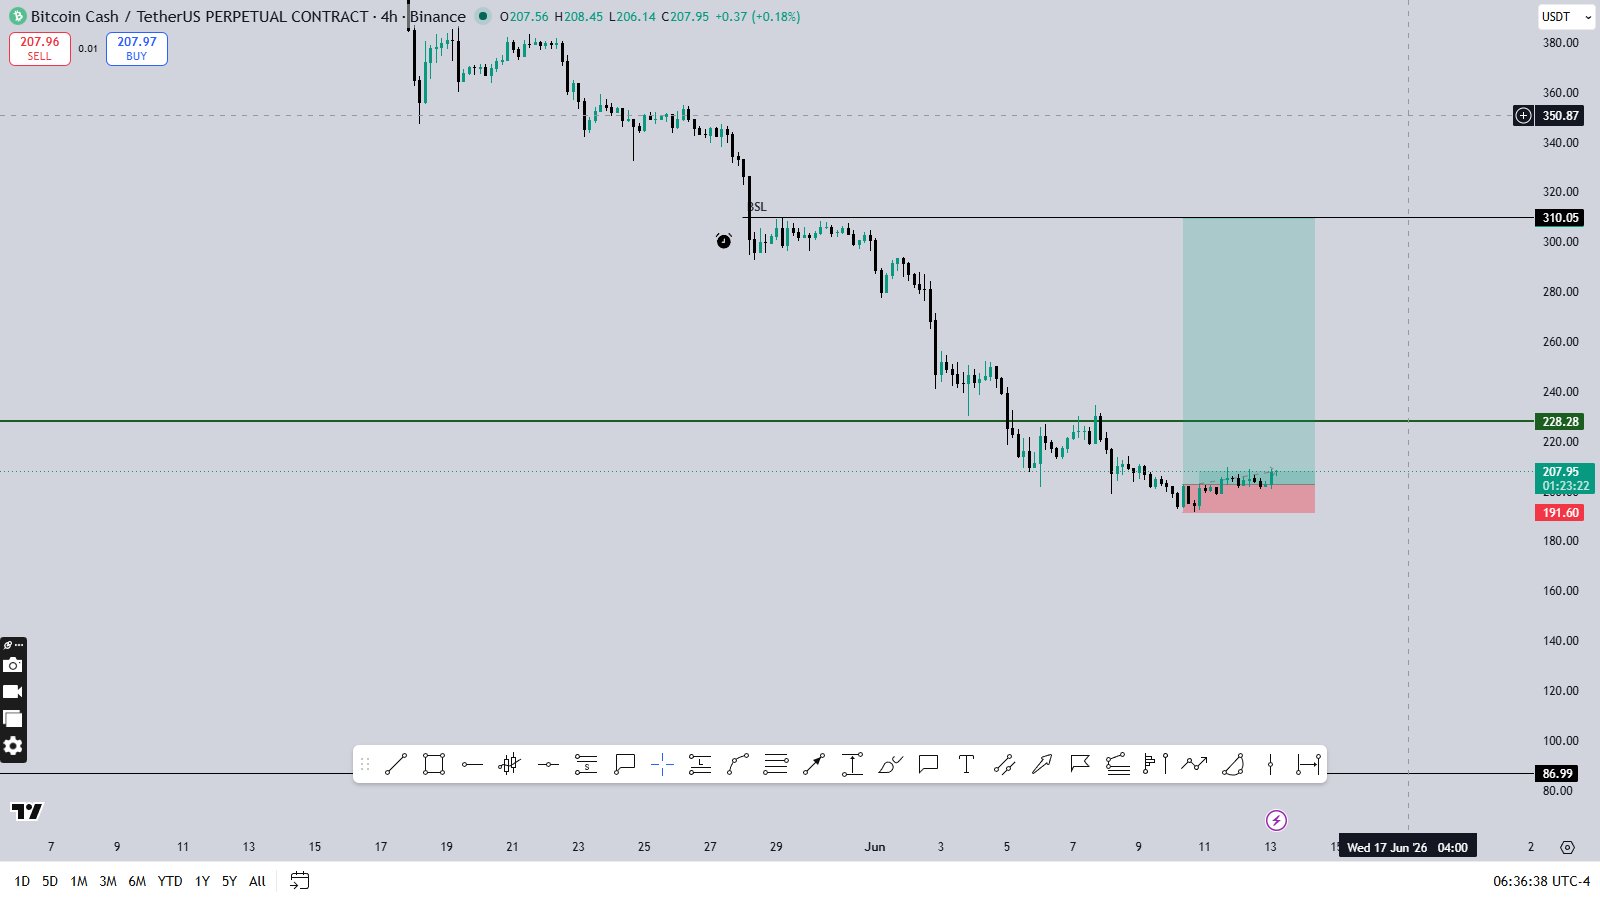 Erik Trader TA_Analyst C13.84K @ero_crypto
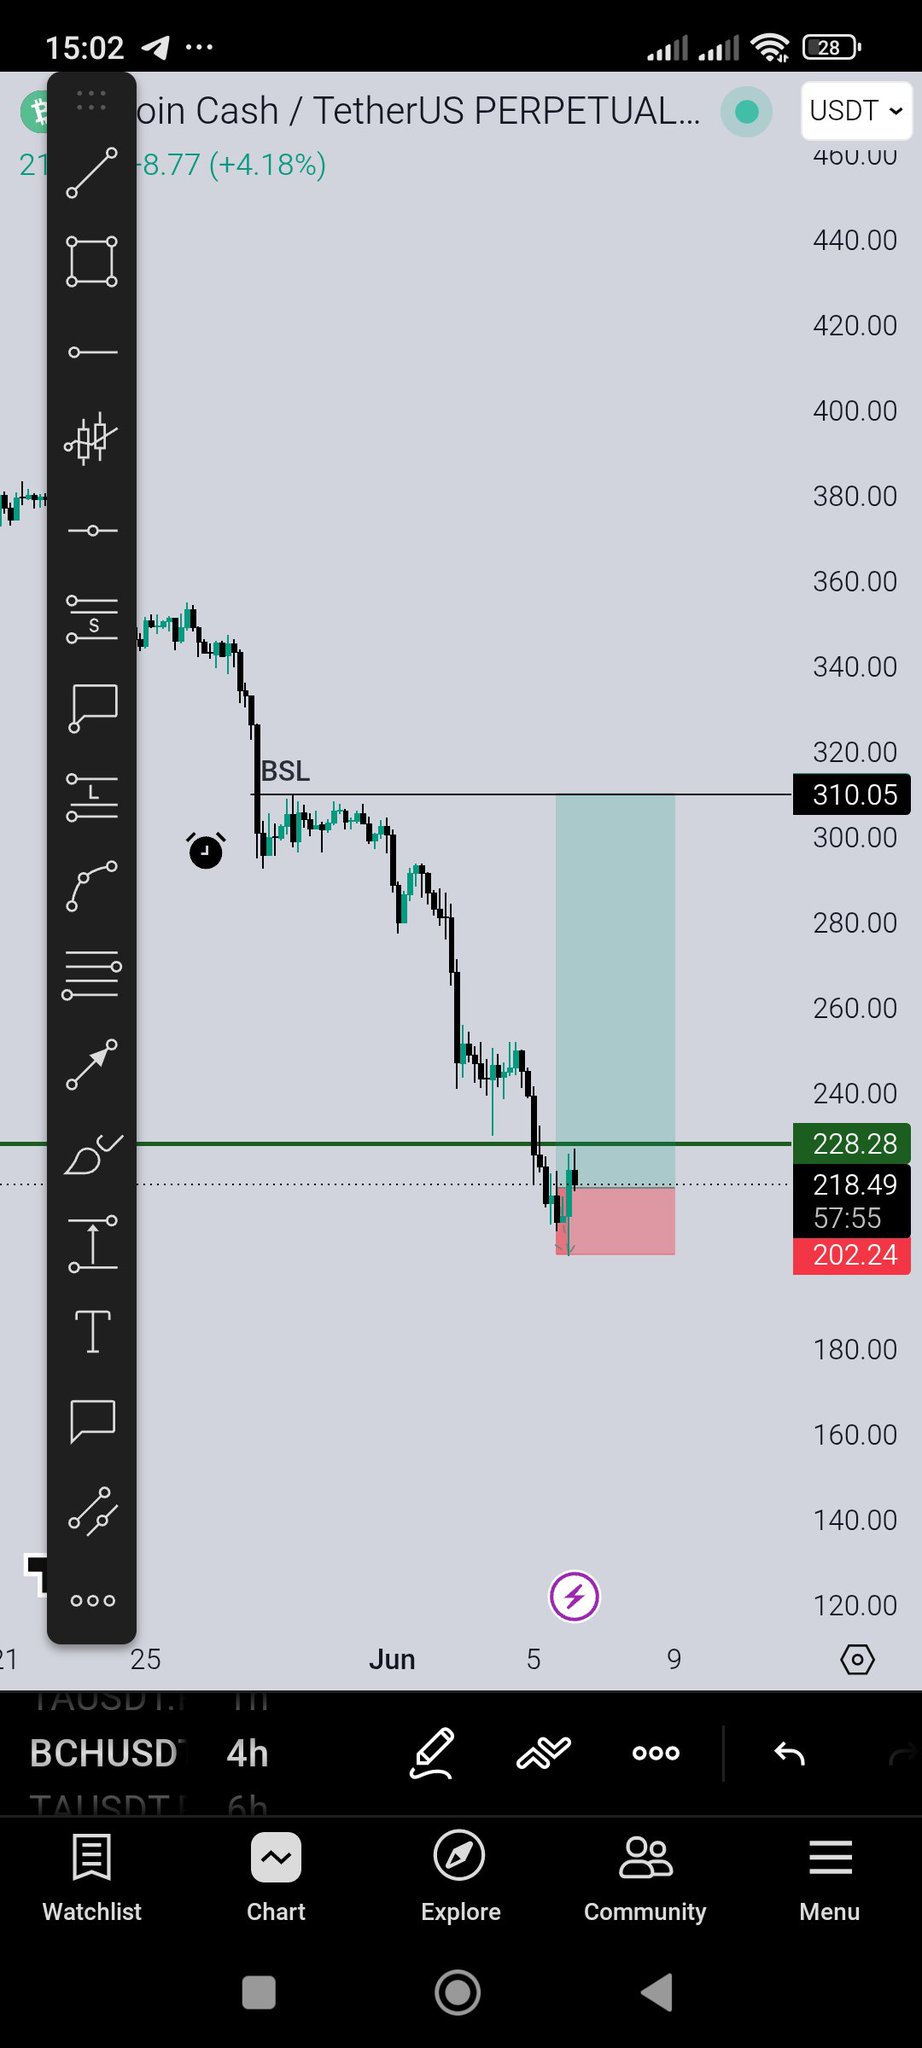 11 2 1.27K 閱讀原文 >釋出後BCH走勢看漲
- Bitcoin Takeover (BTCTKVR.com) Educator Media C4.16K @BTCTKVRBitcoin Takeover (BTCTKVR.com) Educator Media C4.16K @BTCTKVR
 16 0 236 閱讀原文 >釋出後BCH走勢極度看漲
 - 釋出後BCH走勢看跌