
Canaan Inc (CAN) announced that it will acquire a 49% stake in Cipher Mining (CIFR) owned by ABC Projects (Alborz LLC, Bear LLC, Chief Mountain LLC) by issuing 806.4 million Class A common shares (equivalent to 53.8 million American Depositary Receipts). The transaction amount is $39.75 million, and the shares are subject to a six‑month lock‑up period. (CoinDesk)
https://t.co/fLgaYUcy2k
Mua tiền điện tử
thẻ
Giao dịch P2P
Mua USDT trên thị trường
Thẻ Credit/Debit
Mua tiền mã hóa bằng thẻ Visa hoặc MasterCard
Dịch vụ thanh toán của bên thứ ba
Mua tiền mã hóa qua MoonPay, Simplex và nhiều dịch vụ khác
BitMart Card
Giúp bạn sống theo phong cách tiền mã hóa
Thẻ trả trước tiền mã hóa
Nhận thẻ Mastercard có thể sử dụng ngay
USDⓈ-M
Sử dụng USDⓈ làm tài sản đảm bảo
COIN-M
Sử dụng chính COIN làm tài sản đảm bảo
TradFi
Dịch vụ giao dịch trọn gói cho kim loại, cổ phiếu và ngoại hối
Giao dịch demo
Tìm hiểu cách giao dịch không gặp rủi ro
Tổng quan về Futures
Nền tảng toàn diện cho Futures
Futures King
Quỹ thưởng 478,000 USDT
Tăng trưởng
Rewards
Rút thăm Futures hàng ngày
100% cơ hội chiến thắng với giao dịch hàng ngày
Rút thăm Spot hàng ngày
Nhận các giải thưởng lớn trị giá 8,888 USDT
Nạp tiền điện thoại
Nạp tiền điện thoại di động dễ dàng, online, bảo mật
Send
Send money globally, fast and secure
BitMart Mall
Trực tiếp trên tiền mã hóa

Channels (CAN)
$ 0.00024 (CAN/USD)
4.17%
24H
Channels CAN Lịch sử giá USD
Theo dõi giá của Channels hôm nay, 7 ngày, 30 ngày và 90 ngày
Kỳ
Thay đổi
Biến động (%)
Hôm nay
$ 0.0000099
4.17%
7ngày
$ 0.0000099
4.17%
30ngày
$ 0.000019
-7.41%
90ngày
$ 0.000019
-7.41%
Sở hữu CAN ngay
Mua và bán CAN dễ dàng và an toàn trên BitMart.
Channels Thông tin thị trường
$ 0.00023 Biến động 24 giờ $ 0.00024
Cao nhất từng ghi nhận
$ 92.29
Thấp nhất từng ghi nhận
$ 0.00012
Biến động 24 giờ
4.17%
Khối lượng 24 giờ
$ 56.70
Nguồn cung lưu hành
0.00
CAN
Vốn hóa thị trường
$ 0
Nguồn cung tối đa
1.00B
CAN
Vốn hóa thị trường đã pha loãng hoàn toàn
$ 249.71K
Giao dịch CAN
Channels X Insight

吴说区块链
Media
Educator
D
 177.6K @wublockchain12
 Trung tính
Canaan acquires 49% stake in Cipher Mining with the issuance of 806.4 million shares, transaction amount $39.75 million
 1
1
 1
1
 358
358
2026-02-24 11:21
Xu hướng của CAN sau khi phát hành
Trung tính
Canaan acquires 49% stake in Cipher Mining with the issuance of 806.4 million shares, transaction amount $39.75 million

Ace of Trades
TA_Analyst
Trader
C
14.6K @acethebullly Trung tính
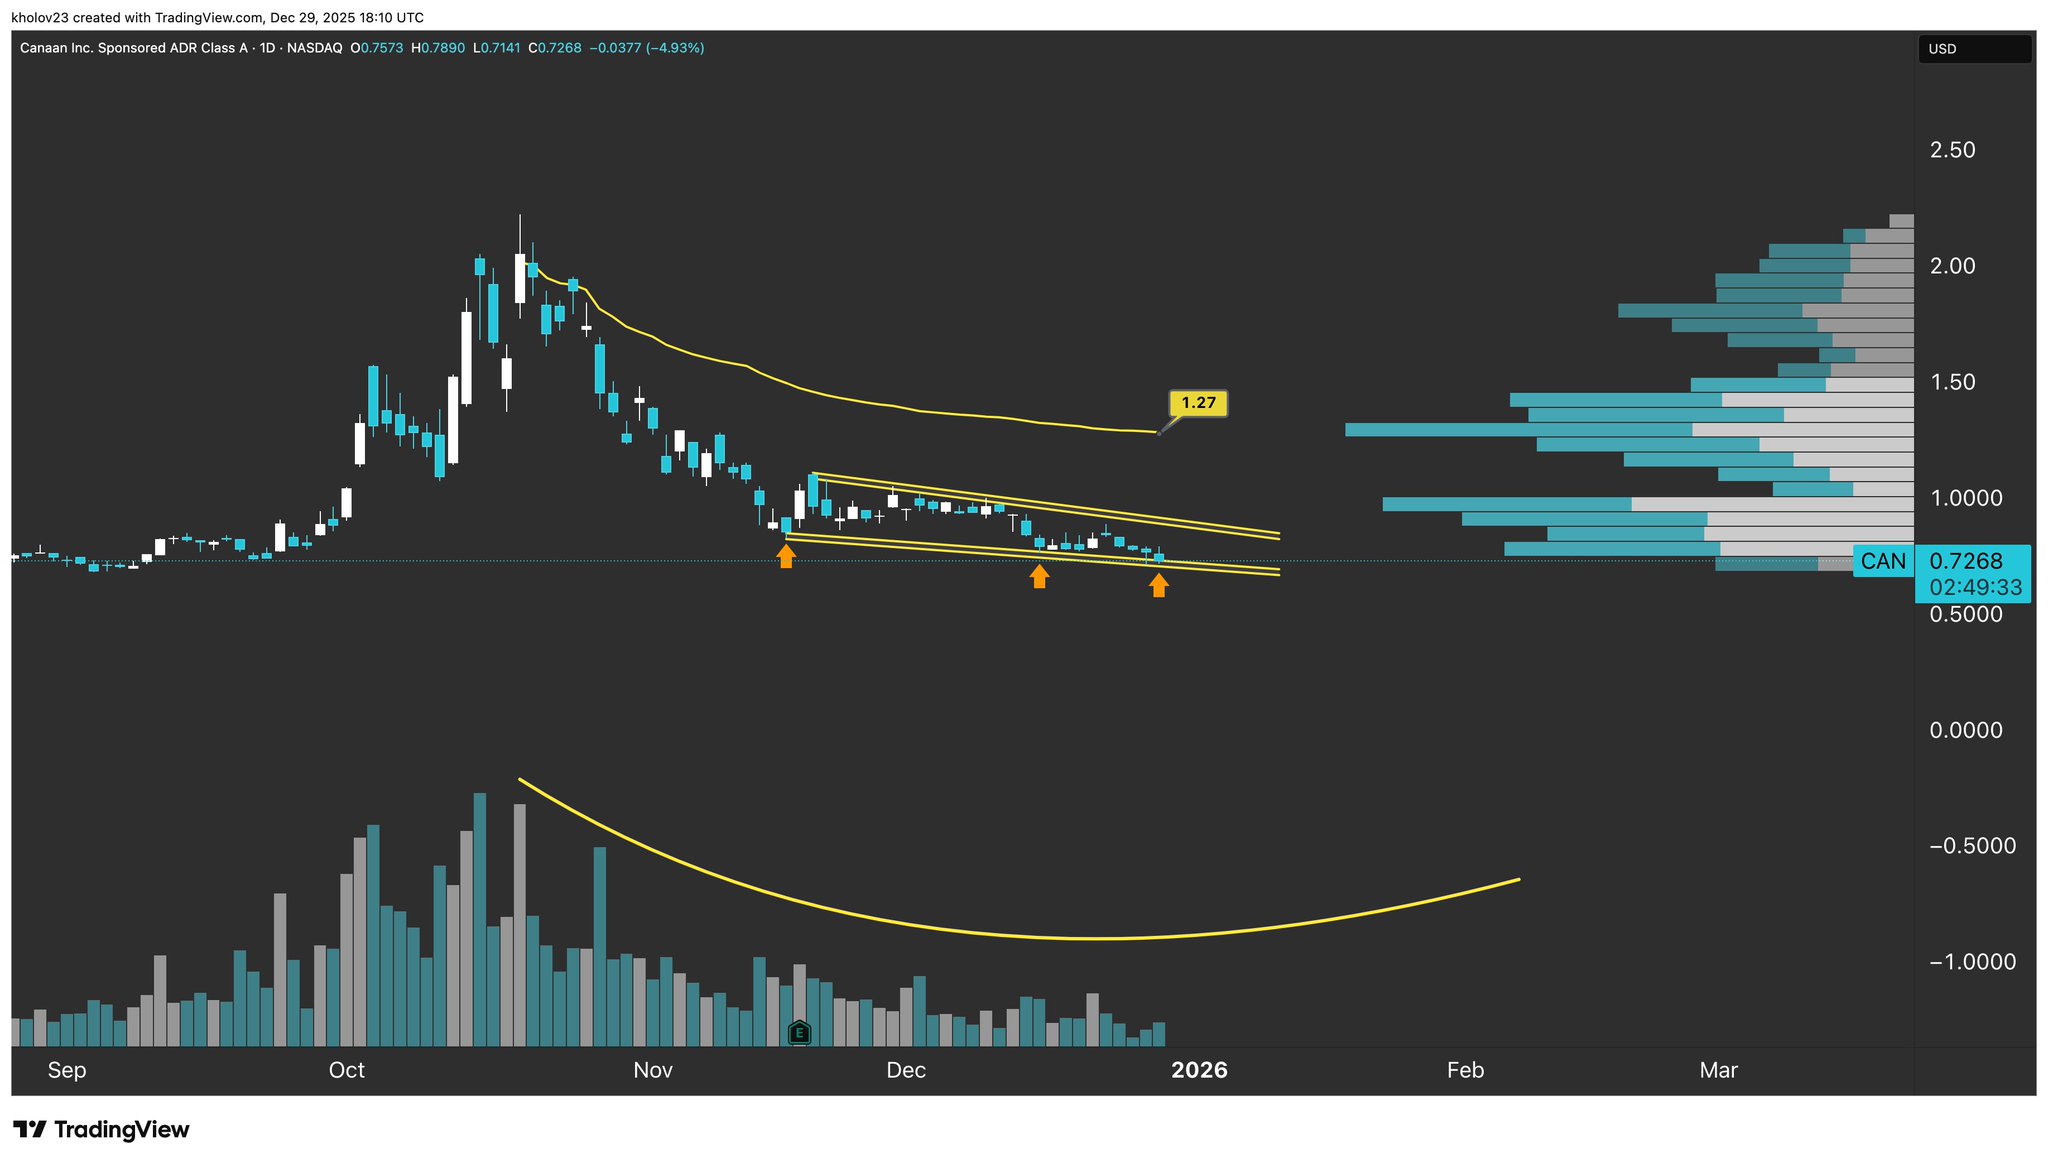
CAN price has touched the descending channel support level for the third time, indicating a potential technical rebound opportunity.
$CAN

Mr Chart Norris D
20.1K @kholov23 $CAN Daily Candle Chart
Thats your THIRD touch
 7
1
2.2K
7
1
2.2K
2025-12-29 23:27
Xu hướng của CAN sau khi phát hành
Trung tính
CAN price has touched the descending channel support level for the third time, indicating a potential technical rebound opportunity.
Ace of Trades
TA_Analyst
Trader
C
14.6K @acethebullly Tăng giá
CAN is consolidating in the 0.87‑1.03 range, fundamentals are favorable, and short-term support remains.
Stop crying 😭
This guy just handed all his gains back on a silver platter.
Classic bag holder move 🤣🤣

Ali Hshrof | ₿ D
349 @Ali_hashroof The chart read is incomplete. $CAN isn’t in a “full bearish alignment” — it’s in a low-volume accumulation range.
Price has been moving sideways between $0.87–$1.03, which is classic post-capitulation basing, not institutional selling. Distribution requires surging volume and breakdown candles — none of which are present. The flattening volatility, thin Ichimoku cloud, and neutral OBV all point to absorption, not rejection.
Calling it a downtrend across all timeframes ignores the fundamental catalysts now stacking beneath the chart:
• Frost & Sullivan ranks Canaan #2 globally in ASIC compute power
• Q3 revenue beat expectations with strong YoY growth
• New partnerships: SynVista Energy (green compute + AI load balancing) and SLNH hosting
• Expanding footprint: Canada, Japan, Ethiopia, North America
• Zero meaningful short interest + 106 institutional holders
• Active share-buyback program
• Industry shift toward efficient ASIC compute (AI + BTC heat-reuse + clean-power mining)
These are not the signals of
0
0
360
2025-12-04 21:57
Xu hướng của CAN sau khi phát hành
Tăng giá
CAN is consolidating in the 0.87‑1.03 range, fundamentals are favorable, and short-term support remains.
Dự đoán giá
Thời điểm phù hợp để mua CAN là khi nào? Liệu tôi nên mua hay bán CAN bây giờ?
Khi quyết định xem đây có phải là thời điểm tốt để mua hoặc bán Channels (CAN) hay không, điều quan trọng trước tiên là phải phù hợp với chiến lược giao dịch và mức độ chấp nhận rủi ro của riêng bạn. Các nhà đầu tư dài hạn và các nhà giao dịch ngắn hạn thường diễn giải điều kiện thị trường theo các cách khác nhau, vì vậy quyết định của bạn nên phản ánh cách tiếp cận cá nhân. Theo phân tích kỹ thuật 4 giờ mới nhất của CAN, tín hiệu giao dịch hiện tại là Hold. Theo phân tích kỹ thuật 1 ngày mới nhất của CAN, tín hiệu hiện tại là Hold.

Dự đoán Beacon
Dự báo giá xác suất cho (24 giờ tới)Tuyên bố miễn trừ trách nhiệm về dự đoán Beacon
Kết quả dữ liệu hiển thị trên trang này được phân tích dựa trên dữ liệu giao dịch thực tế (OHLCV) của cặp giao dịch đã chọn cùng với các chỉ báo kỹ thuật tương ứng.
Dự đoán này là một sản phẩm kỹ thuật thử nghiệm và chỉ được cung cấp để tham khảo. Đây không phải là lời khuyên đầu tư. Những sự kiện bất ngờ trong thế giới thực có thể tác động đáng kể đến hành vi thị trường. Các nhà giao dịch nên đưa ra quyết định một cách thận trọng.
Dự đoán này là một sản phẩm kỹ thuật thử nghiệm và chỉ được cung cấp để tham khảo. Đây không phải là lời khuyên đầu tư. Những sự kiện bất ngờ trong thế giới thực có thể tác động đáng kể đến hành vi thị trường. Các nhà giao dịch nên đưa ra quyết định một cách thận trọng.
Giới thiệu Channels
Channels (CAN) is a cryptocurrency launched in 2021and operates on the BNB Smart Chain (BEP20) platform. Channels has a current supply of 1,000,000,000 with 0 in circulation. The last known price of Channels is 0.0002423 USD and is up 2.07 over the last 24 hours. It is currently trading on 20 active market(s) with $0.00 traded over the last 24 hours. More information can be found at https://bsc.channels.finance/.
Đọc thêm
Link chính thức
Trình khám phá chuỗi
Khám phá thêm
BM Discovery


Mới niêm yết

ATEG ATEG.DV
-- 0.00%

GCOIN G COIN
-- 0.00%

ISK$ Iskander Coin
-- 0.00%

$BLAST SafeBLAST
-- 0.00%

SPYON SPDR S&P 500 Tokenized ETF (Ondo)
-- 0.00%

QQQON Invesco QQQ Tokenized ETF (Ondo)
-- 0.00%

MCDON McDonald's Tokenized Stock (Ondo)
-- 0.00%

MSTRON MicroStrategy Tokenized Stock (Ondo)
-- 0.00%

AVGOON Broadcom Tokenized Stock (Ondo)
-- 0.00%

CRCLON Circle Internet Group Tokenized Stock (Ondo)
-- 0.00%