Canaan Inc (CAN) announced that it will acquire a 49% stake in Cipher Mining (CIFR) owned by ABC Projects (Alborz LLC, Bear LLC, Chief Mountain LLC) by issuing 806.4 million Class A common shares (equivalent to 53.8 million American Depositary Receipts). The transaction amount is $39.75 million, and the shares are subject to a six‑month lock‑up period. (CoinDesk)
https://t.co/fLgaYUcy2k
Comprar criptomoedas
cartão
Negociação P2P
Compre USDT via marketplace
Cartão de Crédito/Débito
Compre criptomoedas com Visa ou Mastercard
Pagamento de terceiros
Compre criptomoedas pela MoonPay, Simplex e outras
Cartão BitMart
Fortalecendo sua jornada no mundo cripto
Cartão Pré-pago de Cripto
Obtenha seu Mastercard utilizável na hora
USDⓈ-M
Usando USDⓈ como garantia
COIN-M
Usando a própria MOEDA como garantia
TradFi
Negociação em um só lugar para metais, ações e forex
Demo de Trading
Aprenda a negociar sem risco
Visão geral dos Futuros
Plataforma única para tudo o que é relacionados aos Futuros
Futures King
478.000 USDT em prêmios
Evoluir
Visão Geral do Earn
Ativos Parados, Ganhos com Facilidade no Earn
Economia
Ganhe juros com participações
Apostando
Aposta fácil, recompensas altas
Gestão de Patrimônio
Evolua seu patrimônio com uma equipe de ativos de alto nível
RWA
Mantenha BMRUSD e Aproveite os Rendimentos
Exclusivo VIP
Ganhos de forma estável para usuários VIP
Rewards
Hub de recompensas
Descubra recompensas exclusivas de até 14.000 USDT
LaunchPrime
Uma plataforma de lançamento de token e NFT
Programa de Afiliados
Entre para ganhar altas comissões
Powerdrop
A Solução de Última Geração para Airdrops já está DISPONÍVEL!
Centro de eventos
Seu Hub para Todas as Operações Comerciais
Sorteio Diário de Futuros
Chance de ganhar em todas as negociações diárias
Sorteio diário Spot
Ganhe 8.888 USDT em Prêmios Incríveis
Stake to vote
Ganhe airdrops votando
Instituição
Serviços profissionais e exclusivos
VIP
Desbloquear recompensas exclusivas
Academia
Aprenda rapidamente sobre trading e blockchain
Estágio na BitMart
Comece sua carreira em cripto aqui
BitMart Travel
Serviços globais de viagem em um só lugar
INO
Uma plataforma de lançamento de NFTs
Faça Stake de BMX para Listagem
Compartilhar taxas de transação
APIS
Estabilidade robusta e inúmeros terminais
Programa de Corretores
Ganhe comissões pela integração da API
Notícias
Últimas notícias e visualizações
NFT MARKETPLACE
Um mercado de NFT como nenhum outro
Recarga de Celular
Recarregue celulares online de forma fácil e segura
Send
Send money globally, fast and secure
BitMart Mall
Viva com cripto

Channels (CAN)
$ 0.00024 (CAN/USD)
4.17%
24H
Channels CAN Histórico de Preços USD
Acompanhe o preço de Channels hoje e nos últimos 7, 30 e 90 dias
Período
Mudar
Alterar (%)
Hoje
$ 0.0000099
4.17%
7Dias
$ 0.0000099
4.17%
30Dias
$ 0.000019
-7.41%
90Dias
$ 0.000019
-7.41%
Adquira CAN agora
Compre e venda CAN de forma fácil e segura na BitMart.
Channels Informações de mercado
$ 0.00023 Intervalo de 24h $ 0.00024
Máximo histórico
$ 92.29
Mínimo histórico
$ 0.00012
Alteração 24h
4.17%
24h Vol
$ 56.70
Fornecimento circulante
0.00
CAN
Capitalização de mercado
$ 0
Fornecimento máximo
1.00B
CAN
Capitalização de mercado totalmente diluída
$ 249.71K
Comércio CAN
Ganhar
Coloque suas criptomoedas ociosas para trabalhar e ganhe renda passiva com poupança, staking e muito mais.
Channels X Insight

吴说区块链
Media
Educator
D
 177.6K @wublockchain12
 Neutro
Canaan acquires 49% stake in Cipher Mining with the issuance of 806.4 million shares, transaction amount $39.75 million
 1
1
 1
1
 358
358
2026-02-24 11:21
Tendência de CAN após o lançamento
Neutro
Canaan acquires 49% stake in Cipher Mining with the issuance of 806.4 million shares, transaction amount $39.75 million
Ace of Trades
TA_Analyst
Trader
C
14.6K @acethebullly Neutro
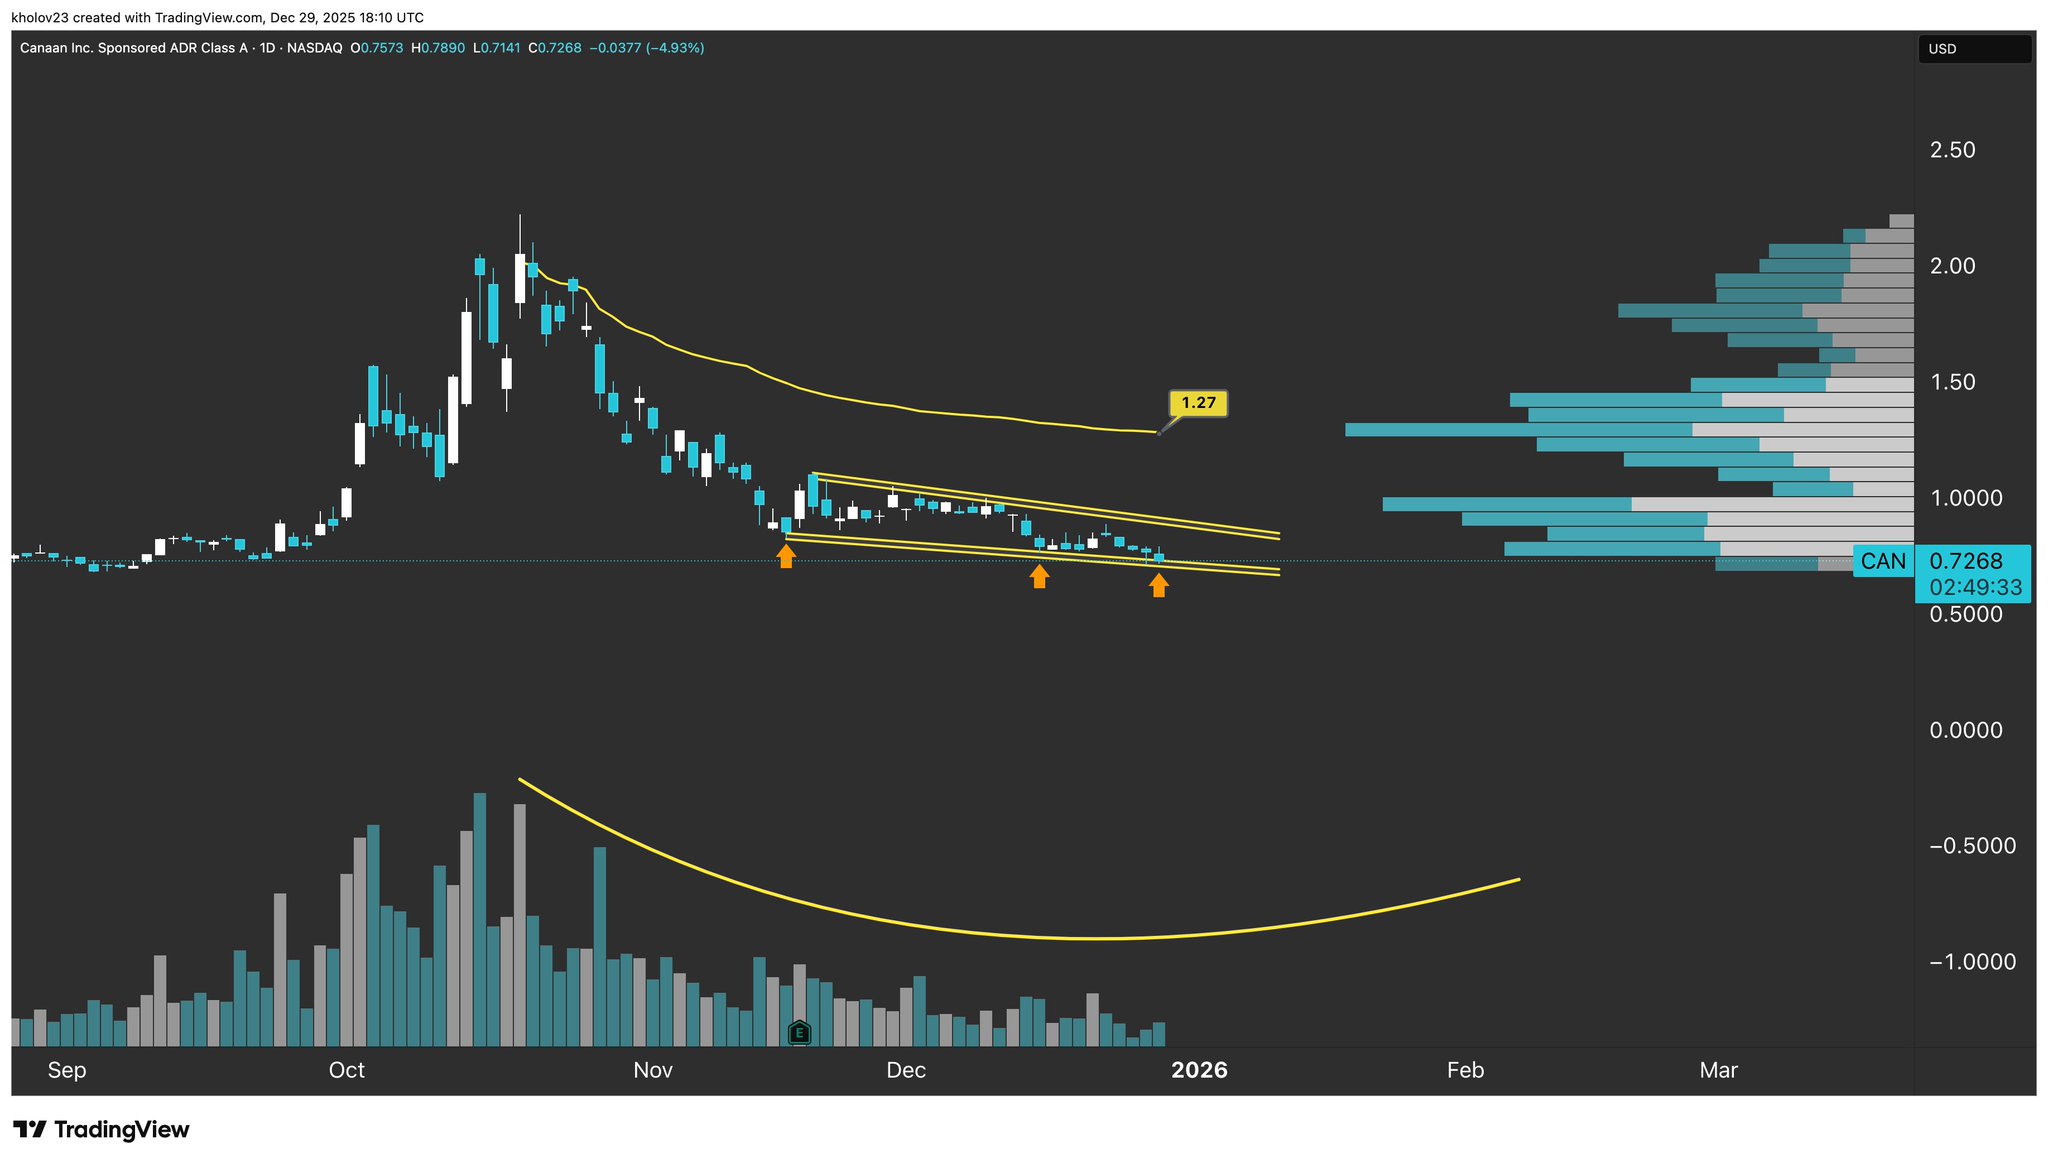
CAN price has touched the descending channel support level for the third time, indicating a potential technical rebound opportunity.
$CAN

Mr Chart Norris D
20.1K @kholov23 $CAN Daily Candle Chart
Thats your THIRD touch
 7
1
2.2K
7
1
2.2K
2025-12-29 23:27
Tendência de CAN após o lançamento
Neutro
CAN price has touched the descending channel support level for the third time, indicating a potential technical rebound opportunity.
Ace of Trades
TA_Analyst
Trader
C
14.6K @acethebullly Altista
CAN is consolidating in the 0.87‑1.03 range, fundamentals are favorable, and short-term support remains.
Stop crying 😭
This guy just handed all his gains back on a silver platter.
Classic bag holder move 🤣🤣

Ali Hshrof | ₿ D
349 @Ali_hashroof The chart read is incomplete. $CAN isn’t in a “full bearish alignment” — it’s in a low-volume accumulation range.
Price has been moving sideways between $0.87–$1.03, which is classic post-capitulation basing, not institutional selling. Distribution requires surging volume and breakdown candles — none of which are present. The flattening volatility, thin Ichimoku cloud, and neutral OBV all point to absorption, not rejection.
Calling it a downtrend across all timeframes ignores the fundamental catalysts now stacking beneath the chart:
• Frost & Sullivan ranks Canaan #2 globally in ASIC compute power
• Q3 revenue beat expectations with strong YoY growth
• New partnerships: SynVista Energy (green compute + AI load balancing) and SLNH hosting
• Expanding footprint: Canada, Japan, Ethiopia, North America
• Zero meaningful short interest + 106 institutional holders
• Active share-buyback program
• Industry shift toward efficient ASIC compute (AI + BTC heat-reuse + clean-power mining)
These are not the signals of
0
0
360
2025-12-04 21:57
Tendência de CAN após o lançamento
Altista
CAN is consolidating in the 0.87‑1.03 range, fundamentals are favorable, and short-term support remains.
Previsão de preço
Quando é um bom momento para comprar CAN? Devo comprar ou vender CAN agora?
Ao decidir se é um bom momento para comprar ou vender Channels (CAN), é importante primeiro se alinhar à sua própria estratégia de trading e perfil de risco. Investidores de longo prazo e traders de curto prazo geralmente interpretam as condições de mercado de forma diferente, então sua decisão deve refletir a sua abordagem pessoal. De acordo com a análise técnica de 4 horas mais recente de CAN, o sinal de trading atual é Hold. De acordo com a mais recente análise técnica de 1 dia de CAN, o sinal atual é Hold.

Previsão do Beacon
Previsão Probabilística de Preço (Próximas 24 horas)Aviso de Isenção de Responsabilidade de Previsões do Beacon
Os resultados dos dados exibidos nesta página são analisados com base em dados de negociação reais (OHLCV) do par de trading selecionado, juntamente com indicadores técnicos correspondentes.
Esta previsão é um produto técnico experimental, fornecida apenas para fins de referência. Ela não constitui uma orientação de investimento. Eventos inesperados no mundo real podem afetar significativamente o comportamento do mercado. Os traders devem tomar decisões com cautela.
Esta previsão é um produto técnico experimental, fornecida apenas para fins de referência. Ela não constitui uma orientação de investimento. Eventos inesperados no mundo real podem afetar significativamente o comportamento do mercado. Os traders devem tomar decisões com cautela.
Sobre Channels
Channels (CAN) is a cryptocurrency launched in 2021and operates on the BNB Smart Chain (BEP20) platform. Channels has a current supply of 1,000,000,000 with 0 in circulation. The last known price of Channels is 0.0002423 USD and is up 2.07 over the last 24 hours. It is currently trading on 20 active market(s) with $0.00 traded over the last 24 hours. More information can be found at https://bsc.channels.finance/.
Leia mais
Links oficiais
Explorador de rede
Explore Mais
BM Discovery


Nova Listagem

ATEG ATEG.DV
-- 0.00%

GCOIN G COIN
-- 0.00%

ISK$ Iskander Coin
-- 0.00%

$BLAST SafeBLAST
-- 0.00%

SPYON SPDR S&P 500 Tokenized ETF (Ondo)
-- 0.00%

QQQON Invesco QQQ Tokenized ETF (Ondo)
-- 0.00%

MCDON McDonald's Tokenized Stock (Ondo)
-- 0.00%

MSTRON MicroStrategy Tokenized Stock (Ondo)
-- 0.00%

AVGOON Broadcom Tokenized Stock (Ondo)
-- 0.00%

CRCLON Circle Internet Group Tokenized Stock (Ondo)
-- 0.00%