Iniciar
Escanear para Baixar o Aplicativo
IOS e Android
BitMart / Cripto / AIN

AI Network (AIN)

$
$ 0.065 (AIN/USD)
-8.17%
24H

AI Network AIN Histórico de Preços USD

Acompanhe o preço de AI Network hoje e nos últimos 7, 30 e 90 dias
Período
Mudar
Alterar (%)
Hoje
$ 0.0057
-8.17%
7Dias
$ 0.0046
-6.72%
30Dias
$ 0.033
-34.08%
90Dias
$ 0.029
83.37%

Adquira AIN agora

Compre e venda AIN de forma fácil e segura na BitMart.
Compre/Venda AIN agora
Compre/Venda {0} agora
AI Network Informações de mercado
Último preço $ 0.065
$ 0.065 Intervalo de 24h $ 0.070
Máximo histórico
‎$ 0.21‎
Mínimo histórico
‎$ 0.026‎
Alteração 24h
‎-8.13%‎
24h Vol
‎$ 620,257.87‎
Fornecimento circulante
244.31M AIN
Capitalização de mercado
‎$ 15.91M‎
Fornecimento máximo
1.00B AIN
Capitalização de mercado totalmente diluída
‎$ 65.12M‎
Comércio AIN

Ganhar

Coloque suas criptomoedas ociosas para trabalhar e ganhe renda passiva com poupança, staking e muito mais.
Experimente Agora
Experimente Agora

AI Network X Insight

avatar
AIN rose 43% in 48 hours, from 0.0752 to 0.1077, emphasizing data analysis.

I watched $AIN sit quietly between 0.075–0.082 for nearly 2 days.

While most saw a boring chart, @CoinAnk's Footprint was showing something different buyers were quietly absorbing every dip at 0.0752.
Then it moved. 0.0752 to 0.1077. 43% in 48hrs.

The move wasn't luck. The data was there the whole time.

#CoinAnk makes this level of analysis accessible to anyone.

Join us today:
https://t.co/9AHtpakpnJ

view 18
view 13
view 1.5K
2026-05-21 00:27
Tendência de AIN após o lançamento
Altista
AIN rose 43% in 48 hours, from 0.0752 to 0.1077, emphasizing data analysis.
avatar
If AIN breaks above the $0.1150 resistance, it could rise to $0.16-0.17.

#AIN 👏👏

My analysis for $AIN is currently on target.. If it breaks above the 0,1150 $ resistance, we could see 0,16 / 017. https://t.co/JtJnLcCpWP

view 85
view 4
view 1.9K
2026-04-30 08:12
Tendência de AIN após o lançamento
Altista
If AIN breaks above the $0.1150 resistance, it could rise to $0.16-0.17.
avatar
The author shares a market data interpretation model, emphasizing token structure and cautious chasing of rallies.
avatar

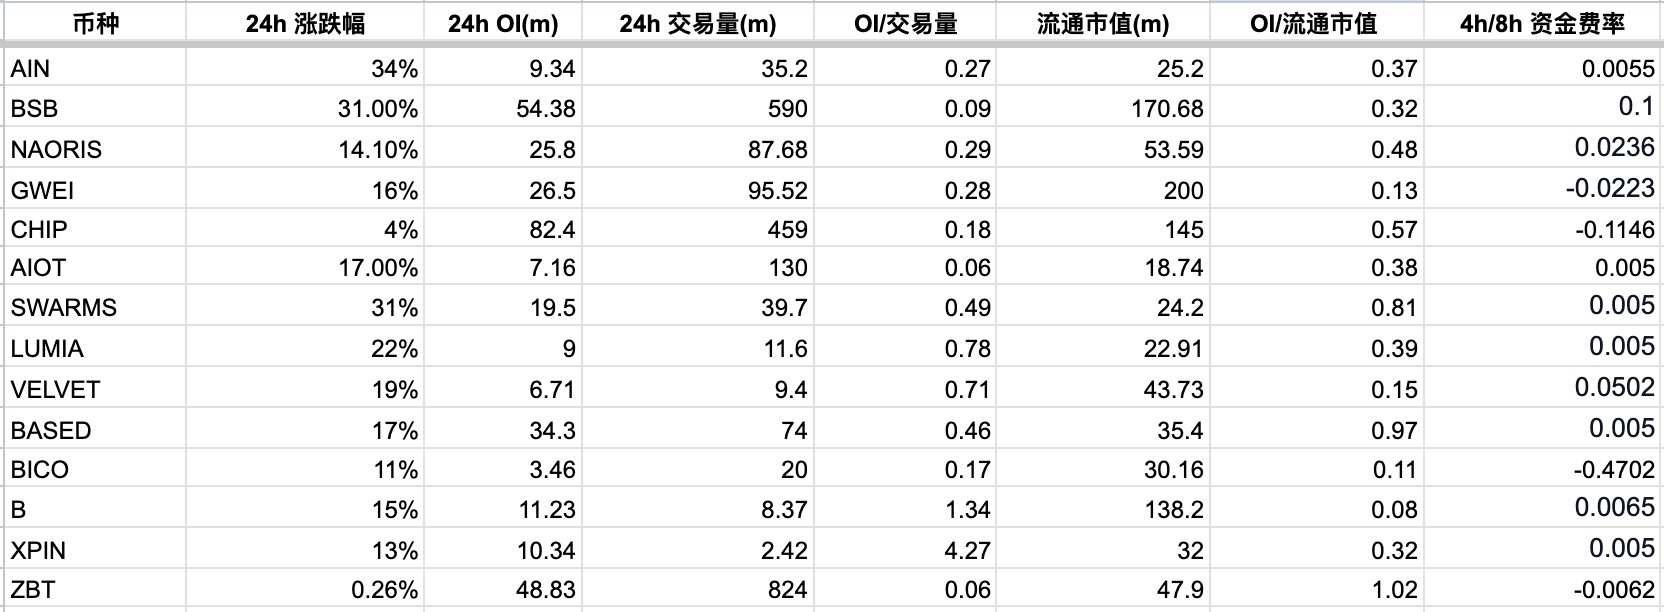
Many people ask what my model is. Actually, looking at the data is just the following metrics: OI, OI/volume, OI/circulating market cap, volume, and then considering the overall funding rate. From the coins below you can see that a negative funding rate does not mean it will rise, nor does a positive funding rate mean it will fall. On the contrary, many of these have a positive funding rate and have been rising for several days, and these data are placed right here; how to interpret them depends on the situation.

For example:

Low volume: can be interpreted as a building phase, or can be interpreted as no need to pay attention due to lack of volume.
Negative funding rate: can be interpreted as shorts needing to cover, or that shorts are too many and the whales cannot push it up.
Gain leaderboard: the first few days it was the first rise on the leaderboard and still could be chased, now these days the rise leaderboard is the final dance.
OI/volume: volume greater than OI indicates high turnover, and may also be whales manipulating data themselves.

Now AI can provide many strategies, but they are for reference only. I feel the core is still looking at the token structure.

view 91
view 22
view 8.3K
2026-04-27 12:12
Tendência de AIN após o lançamento
Neutro
The author shares a market data interpretation model, emphasizing token structure and cautious chasing of rallies.
Detalhes

Previsão de preço

Quando é um bom momento para comprar AIN? Devo comprar ou vender AIN agora?

Ao decidir se é um bom momento para comprar ou vender AI Network (AIN), é importante primeiro se alinhar à sua própria estratégia de trading e perfil de risco. Investidores de longo prazo e traders de curto prazo geralmente interpretam as condições de mercado de forma diferente, então sua decisão deve refletir a sua abordagem pessoal. De acordo com a análise técnica de 4 horas mais recente de AIN, o sinal de trading atual é Hold. De acordo com a mais recente análise técnica de 1 dia de AIN, o sinal atual é Comprar.
40
Hold
Análise técnica de 4 horas de AIN
Última Atualização 2026-06-09 19:59:59
62
Comprar
Análise técnica de 1 dia de AIN
Última Atualização 2026-06-10 00:00:00
beacon

Previsão do Beacon

Previsão Probabilística de Preço (Próximas 24 horas)
i
Aviso de Isenção de Responsabilidade de Previsões do Beacon
Os resultados dos dados exibidos nesta página são analisados com base em dados de negociação reais (OHLCV) do par de trading selecionado, juntamente com indicadores técnicos correspondentes.
Esta previsão é um produto técnico experimental, fornecida apenas para fins de referência. Ela não constitui uma orientação de investimento. Eventos inesperados no mundo real podem afetar significativamente o comportamento do mercado. Os traders devem tomar decisões com cautela.
Sobre AI Network
AI Network (AIN) is a cryptocurrency launched in 2018and operates on the Ethereum platform. AI Network has a current supply of 700,000,000 with 0 in circulation. The last known price of AI Network is 0.00838439 USD and is down -0.96 over the last 24 hours. It is currently trading on 14 active market(s) with $58,272.29 traded over the last 24 hours. More information can be found at https://ainetwork.ai.
Leia mais
Comprar AIN
Comércio AIN