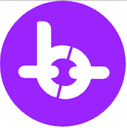
현물 롱 $GRT를 이 4번째 파동에 대해 진행하세요 https://t.co/AviCFhCENU


 25.0K @Michael_EWpro
 현물 롱 $GRT를 이 4번째 파동에 대해 진행하세요 https://t.co/AviCFhCENU
 10
10
 1
1
 1.7K
1.7K
 83.2K @BlocksterCom
  340.5K @graphprotocol
 The reason enterprise adoption moves slowly is not skepticism about the technology. It is the gap between what blockchain can do and what regulated institutions are allowed to touch.
SOC-2 준수. 검증된 노드 운영자. 감사 가능한 데이터.
"The Graph의 로드맵은 이를 해결하고자 하며, 저는 The Graph가 그 대화의 일부가 될 것이라고 매우 낙관하고 있습니다." - Nick, 팀 리드
118
11
11.0K
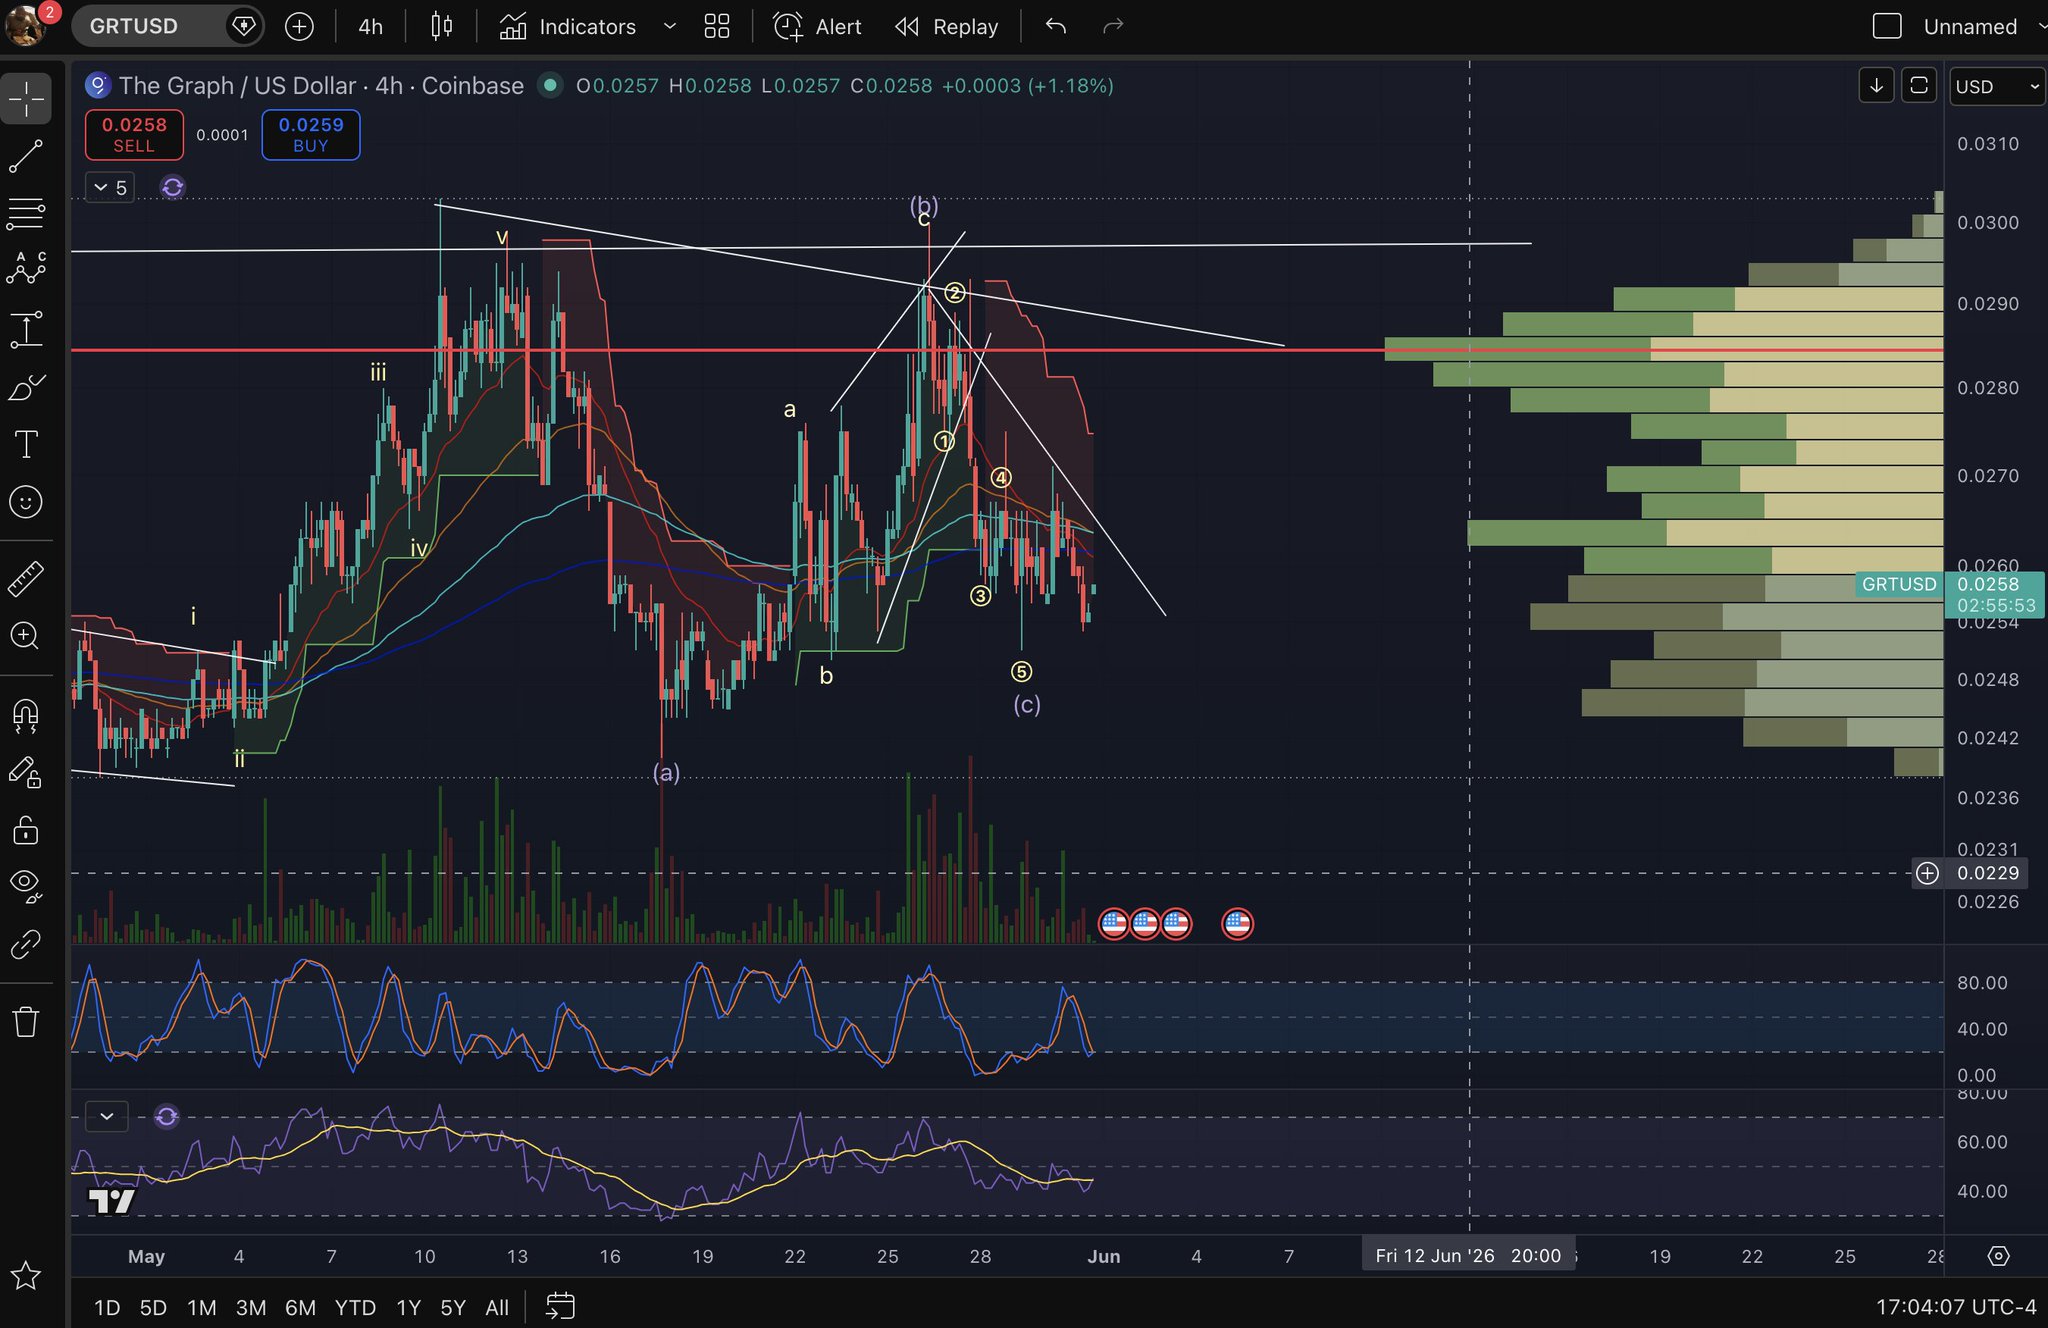
25.0K @Michael_EWpro 이더리움:0xc944e90c64b2c07662a292be6244bdf05cda44a7 위에서 실행 가능하거나 불규칙한 플랫이 나타나는 것으로 보입니다 H4 https://t.co/iHNLGq6wJI
 25.0K @Michael_EWpro
 다음은 이더리움:0xc944e90c64b2c07662a292be6244bdf05cda44a7에 대한 20 bands이며, 비판자들이 나를 계속 흐리게 해도 나는 계속 승리할 것입니다
8
2
2.3K