Rewards
Futures Daily Draw
100% Chance To Win With Daily Trades
현물 일일 추첨
Win 8,888 USDT In Grand Prizes
휴대폰 요금 충전
온라인으로 간편하고 안전하게 휴대폰 요금을 충전하세요.
Send
Send money globally, fast and secure
BitMart Mall
Live on crypto

RAI Finance (SOFI)
$ 0.000049 (SOFI/USD)
0.00%
24H
RAI Finance Live Price data
Today's price of RAI Finance Is $ 0.000049 (SOFI/USD). With A Market Cap Of $ 29,874.37 USD. 24-Hour Trading Volume Of $ 0 USD, A 24-Hour Price Change Of +0.00%, And A Circulating Supply Of 598.31M SOFI.
RAI Finance SOFI Price History USD
Track the price of RAI Finance for today, 7 days, 30 days and 90 days
기간
변경하기
Change (%)
오늘
$ 0
0.00%
7일
$ 0.0000099
25.00%
30일
$ 0.000039
400.00%
90일
$ 0.000019
66.67%
Own SOFI Now
Buy and sell SOFI easily and securely on BitMart.
RAI Finance Market Information
$ 0.000049 24h Range $ 0.000049
All time high
$ 0.00010
All time low
$ 0.0000051
24시간 변동률
0.00%
24시간 거래량
$ 0
유통량
0.59B
SOFI
Market cap
$ 29,874.37
Max supply
--
Fully diluted market cap
$ 49,931.56
거래하기 SOFI

RAI Finance X 인사이트

chad.
기술 분석가
트레이더
B
 21.3K @chad_ventures
 상승세
SOFI가 $19에서 강한 저항에 직면하고 있으며 돌파 시 상승이 기대됩니다.
chad.
기술 분석가
트레이더
B
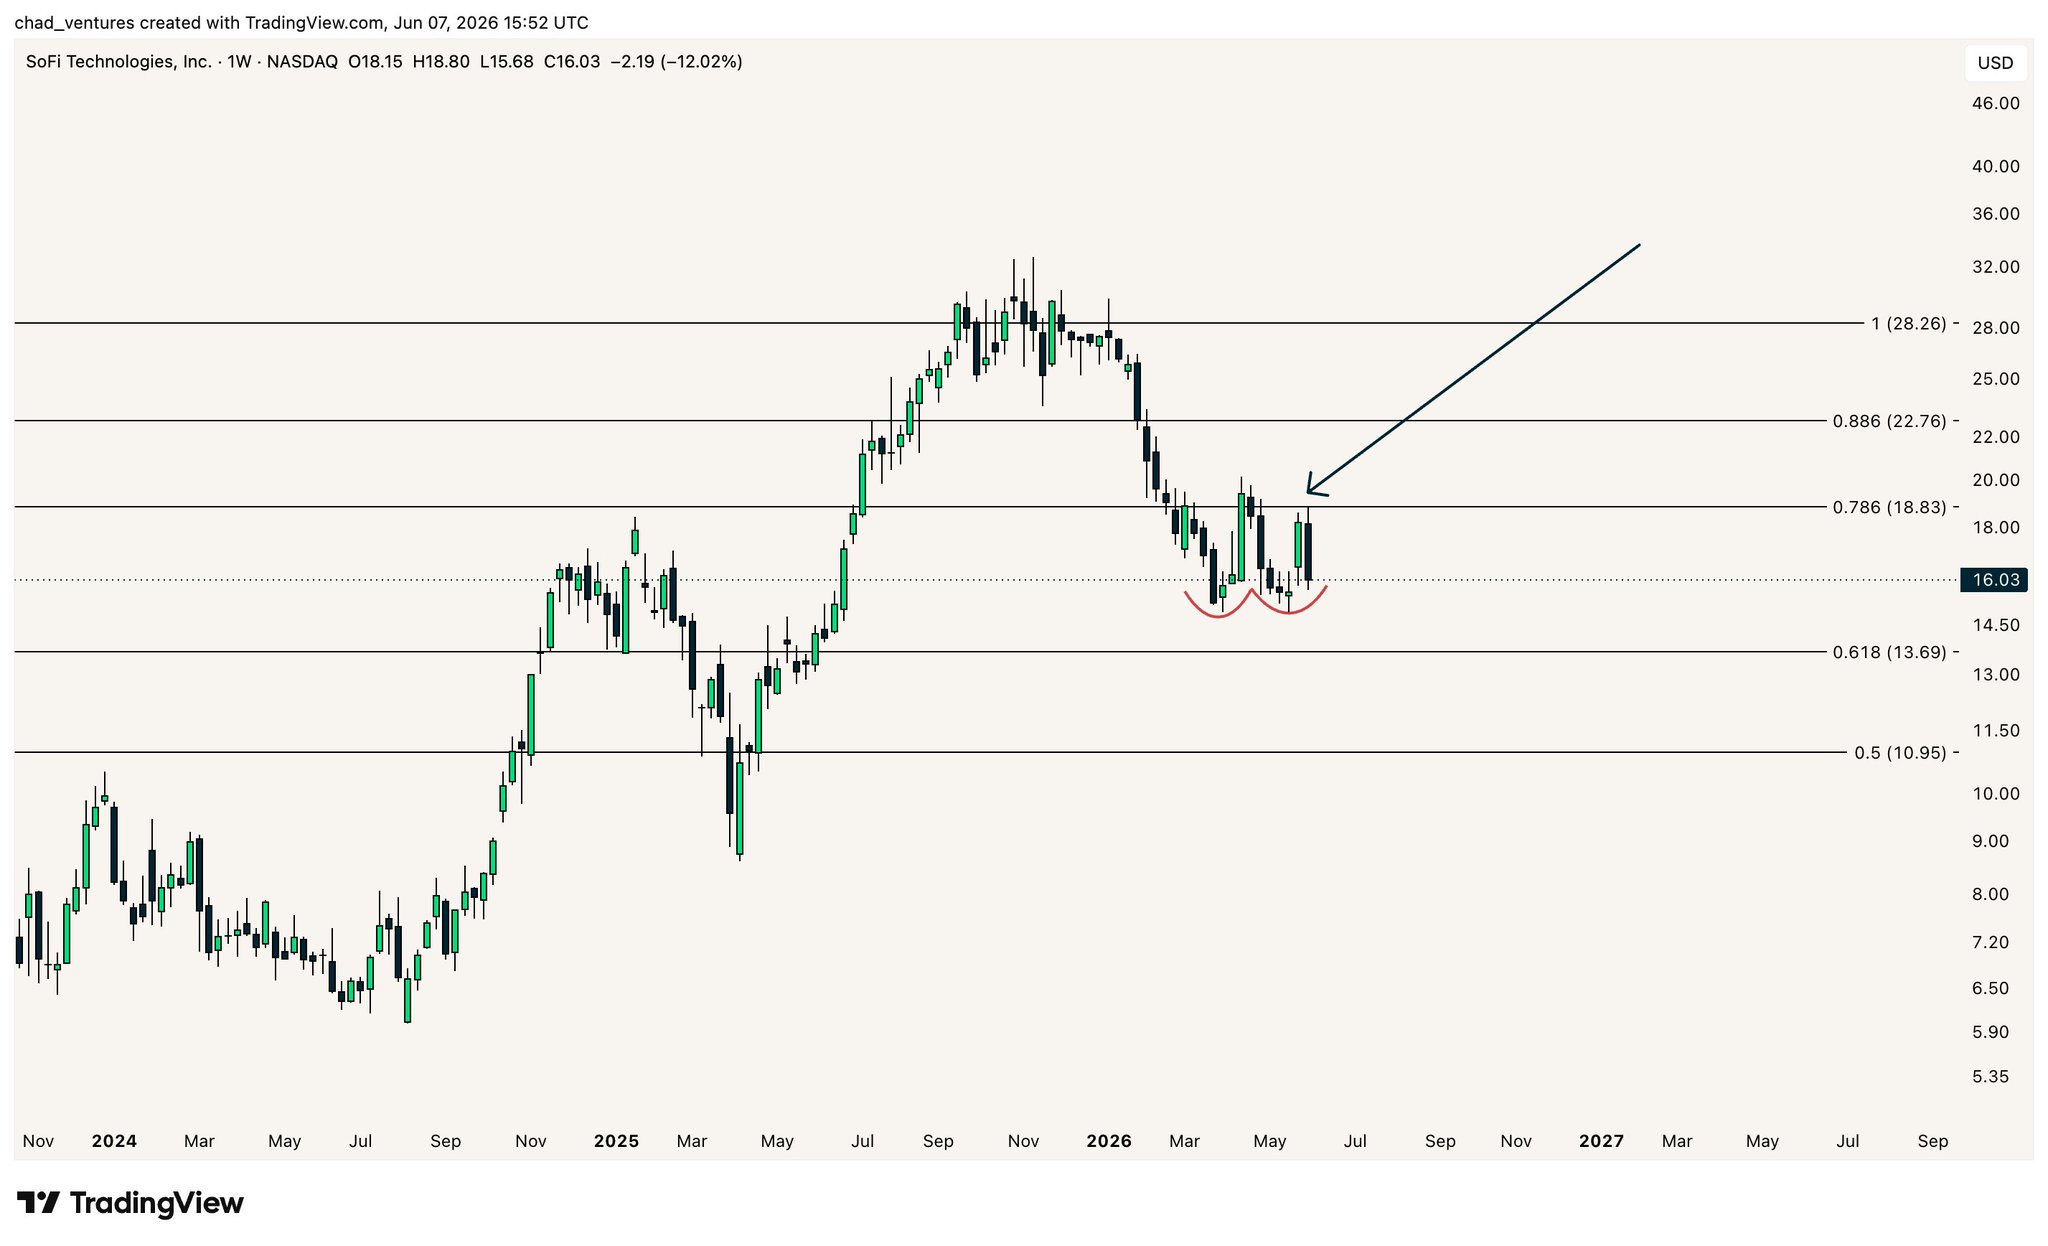
21.3K @chad_ventures $SOFI weekly
$19 근처 강한 저항 구역에 대한 또 다른 공명점은 0.786 로그 피보나치 수준
따라서 $19는 다시 긍정적인 가격 움직임이 발생하기 위해 재획득해야 할 주요 수준입니다 https://t.co/z9Mxk23nB9
 103
103
 4
4
 19.5K
19.5K
2026-06-07 23:17
SOFI의 출시 후 추세
상승세
SOFI가 $19에서 강한 저항에 직면하고 있으며 돌파 시 상승이 기대됩니다.
chad.
기술 분석가
트레이더
B
21.3K @chad_ventures 상승세
SOFI 월간 차트가 상승 컵‑핸들 패턴을 형성하며, 구조가 완전하고 단기 심리는 약세입니다.
chad.
기술 분석가
트레이더
B
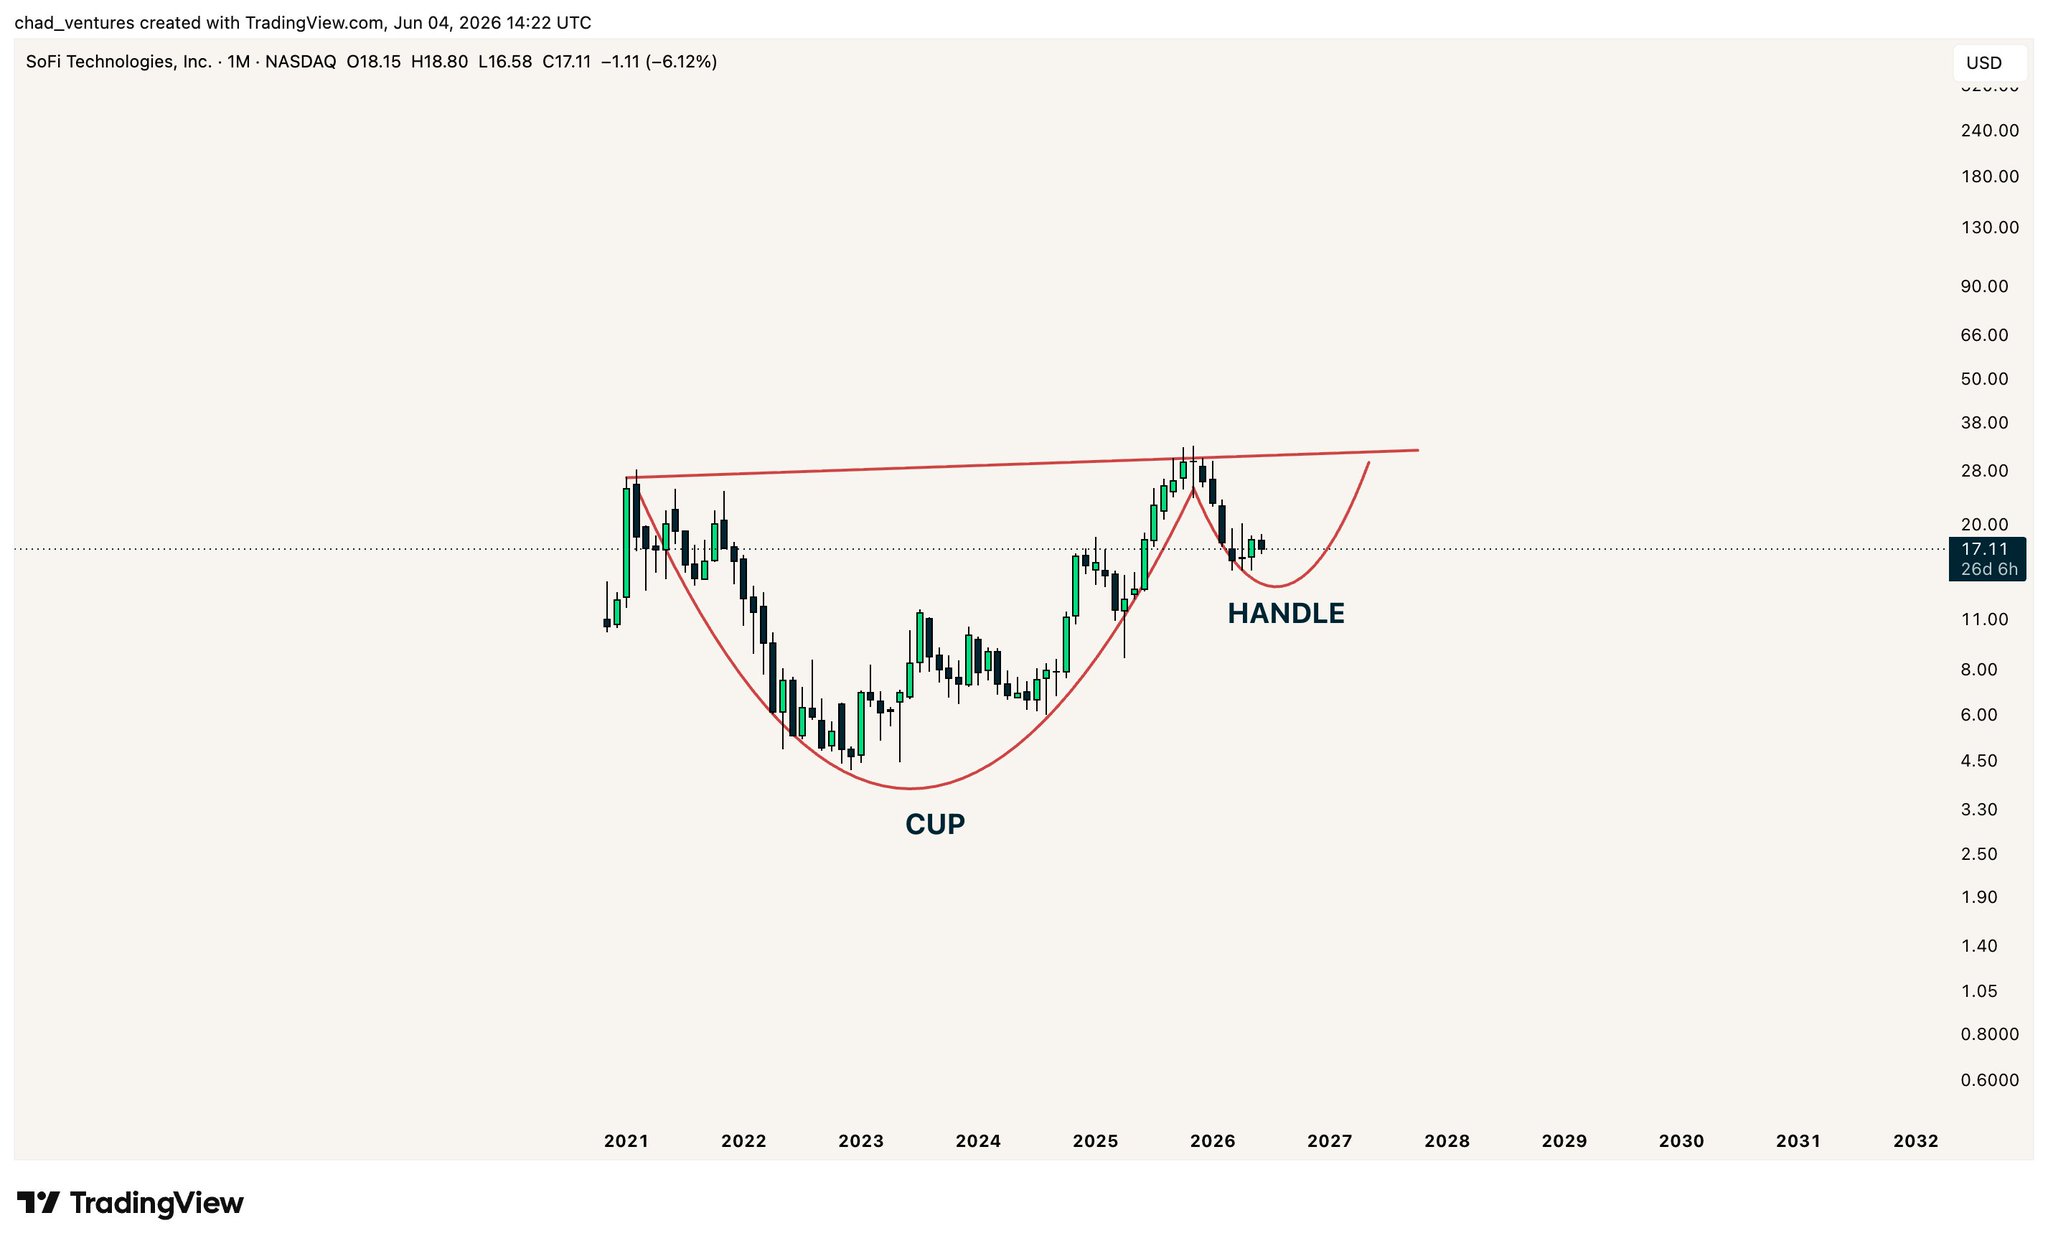
21.3K @chad_ventures $SOFI 월간 컵 & 핸들 형성
핸들의 하단 근처에서는 감정이 항상 끔찍합니다
전체적으로, 여전히 HTF 높은 저점처럼 보이며, 따라서 상승 구조가 완전하고 객관적으로 https://t.co/3hq60r0NKU
 192
6
18.7K
192
6
18.7K
2026-06-04 20:37
SOFI의 출시 후 추세
상승세
SOFI 월간 차트가 상승 컵‑핸들 패턴을 형성하며, 구조가 완전하고 단기 심리는 약세입니다.
chad.
기술 분석가
트레이더
B
21.3K @chad_ventures 중립
SOFI는 $19에 강한 저항을 마주하고 있으며, 돌파하면 바닥 형성을 완료합니다.
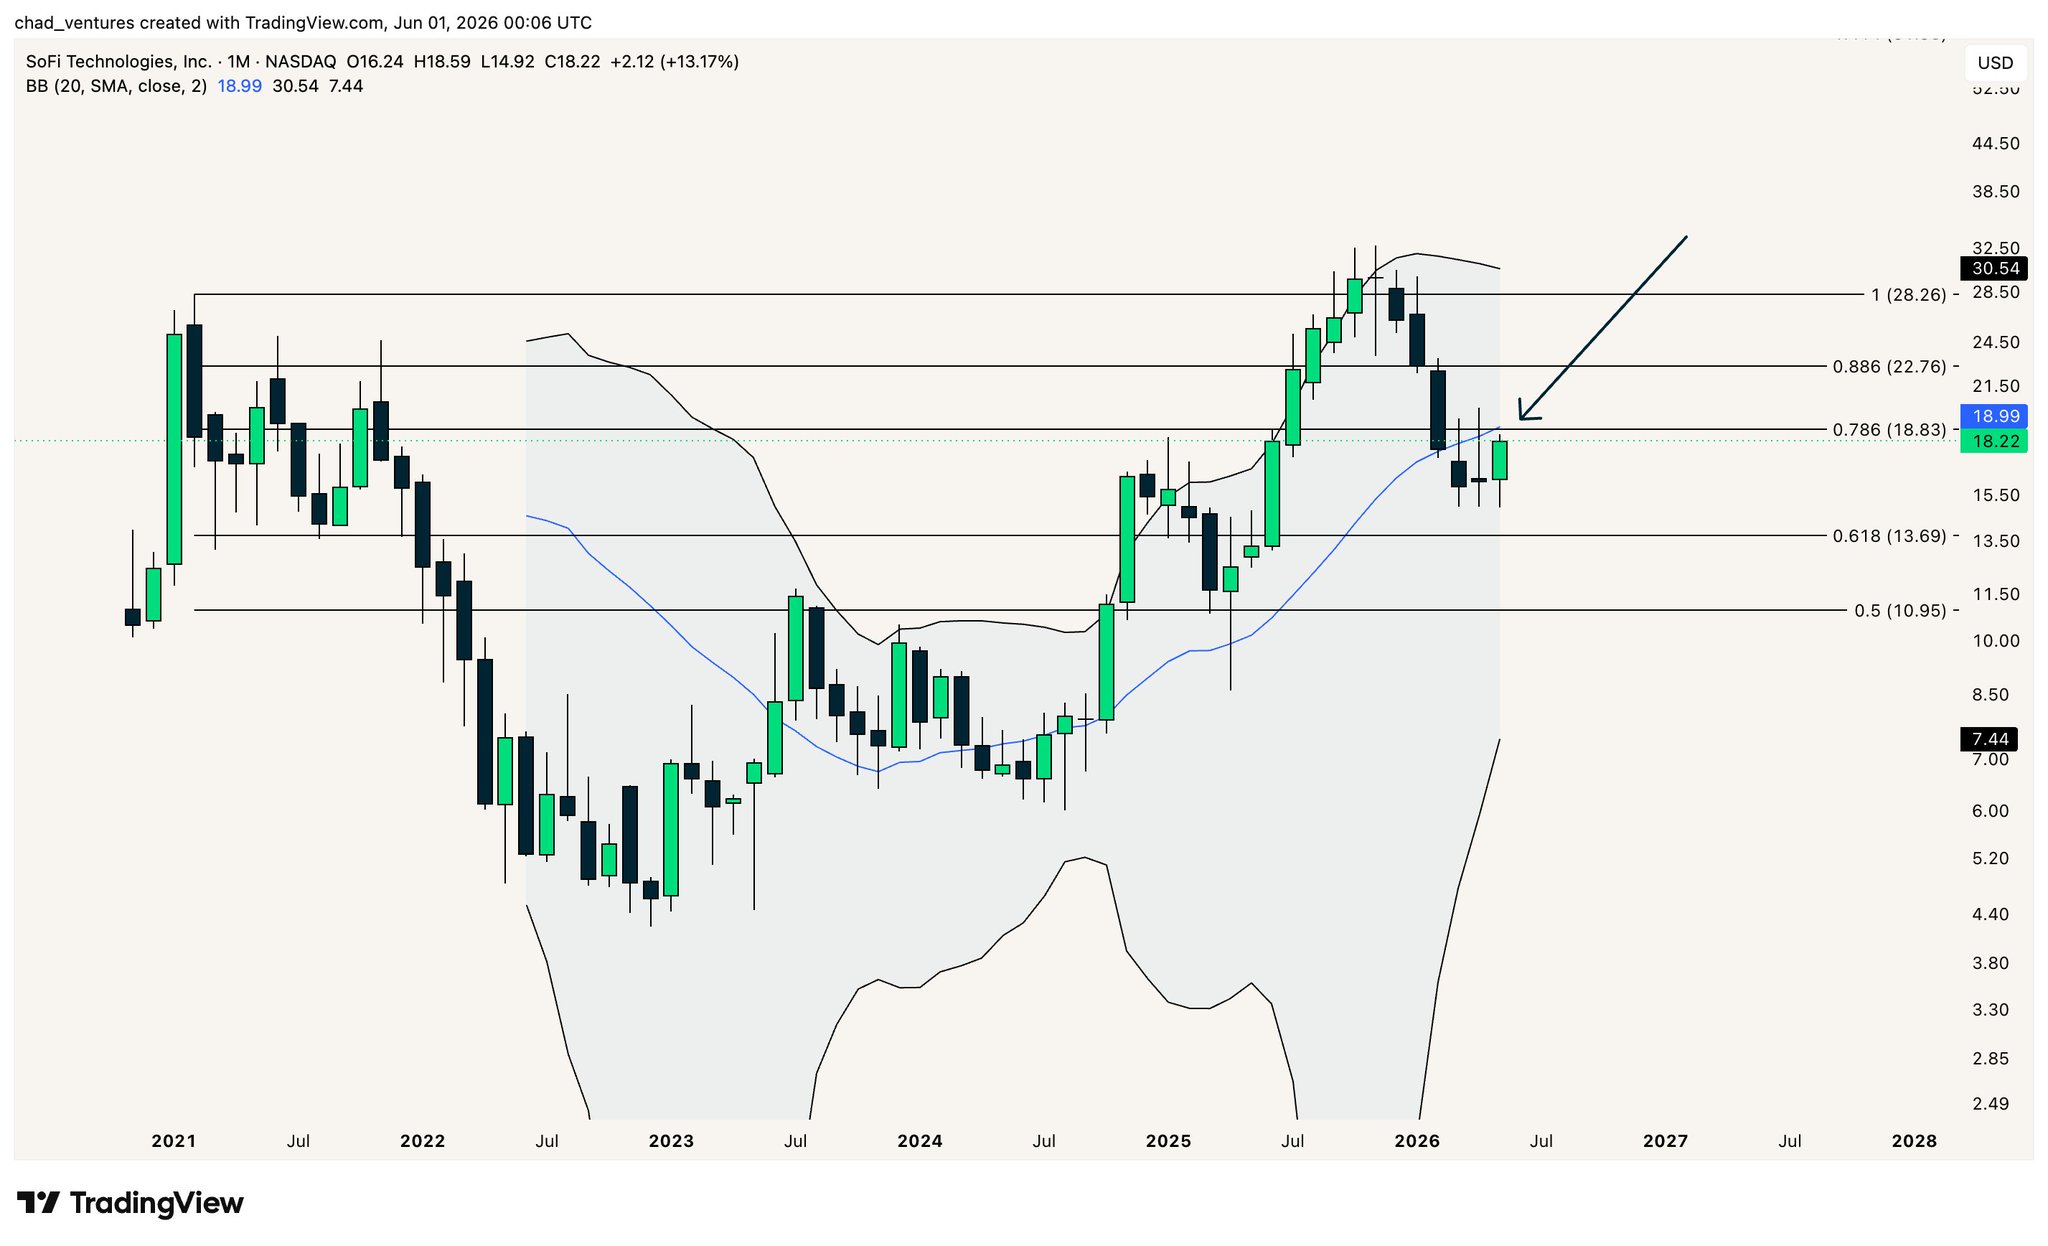
$SOFI는 20개월 SMA와 0.786 로그 피보나치 수준이 형성하는 강한 저항 교차점에 위치하고 있으며, 두 지표 모두 약 $19에 있습니다.
보다 높은 저점을 확인하고 바닥 형성을 마무리하기 위해 해당 영역을 되찾는 것이 필수입니다. https://t.co/RoGiTJbjED
 42
3
3.6K
42
3
3.6K
2026-06-01 00:37
SOFI의 출시 후 추세
중립
SOFI는 $19에 강한 저항을 마주하고 있으며, 돌파하면 바닥 형성을 완료합니다.
가격 예측
When is a good time to buy SOFI? Should I buy or sell SOFI now?
When deciding whether it’s a good time to buy or sell RAI Finance (SOFI), it’s important to first align with your own trading strategy and risk profile.Long-term investors and short-term traders often interpret market conditions differently, so your decision should reflect your personal approach. According to the latest SOFI 4-hour technical analysis, the current trading signal is Hold. According to the latest SOFI 1-day technical analysis, the current signal is Hold.

Beacon Prediction
Probabilistic Price Forecast (Next 24 Hours)Beacon Prediction Disclaimer
The data results displayed on this page are analyzed based on actual trading data (OHLCV) of the selected trading pair along with corresponding technical indicators.
This prediction is an experimental technical product and is provided for reference purposes only. It does not constitute investment advice. Unexpected real-world events may significantly impact market behavior. Traders should make decisions with caution.
This prediction is an experimental technical product and is provided for reference purposes only. It does not constitute investment advice. Unexpected real-world events may significantly impact market behavior. Traders should make decisions with caution.
소개 RAI Finance
RAI Finance (SOFI) is a cryptocurrency and operates on the Ethereum platform. RAI Finance has a current supply of 1,000,000,000 with 598,306,249.79 in circulation. The last known price of RAI Finance is 0.00004697 USD and is up 5.79 over the last 24 hours. It is currently trading on 21 active market(s) with $0.00 traded over the last 24 hours. More information can be found at https://rai.finance/.
자세히 읽어보기
Chain Explorer
Explore More
BM 디스커버리


새 리스팅

ZTRA Zentra Privacy
-- 0.00%

ATEG ATEG.DV
-- 0.00%

GCOIN G COIN
-- 0.00%

ISK$ Iskander Coin
-- 0.00%

$BLAST SafeBLAST
-- 0.00%

SPYON SPDR S&P 500 Tokenized ETF (Ondo)
-- 0.00%

QQQON Invesco QQQ Tokenized ETF (Ondo)
-- 0.00%

MCDON McDonald's Tokenized Stock (Ondo)
-- 0.00%

MSTRON MicroStrategy Tokenized Stock (Ondo)
-- 0.00%

AVGOON Broadcom Tokenized Stock (Ondo)
-- 0.00%