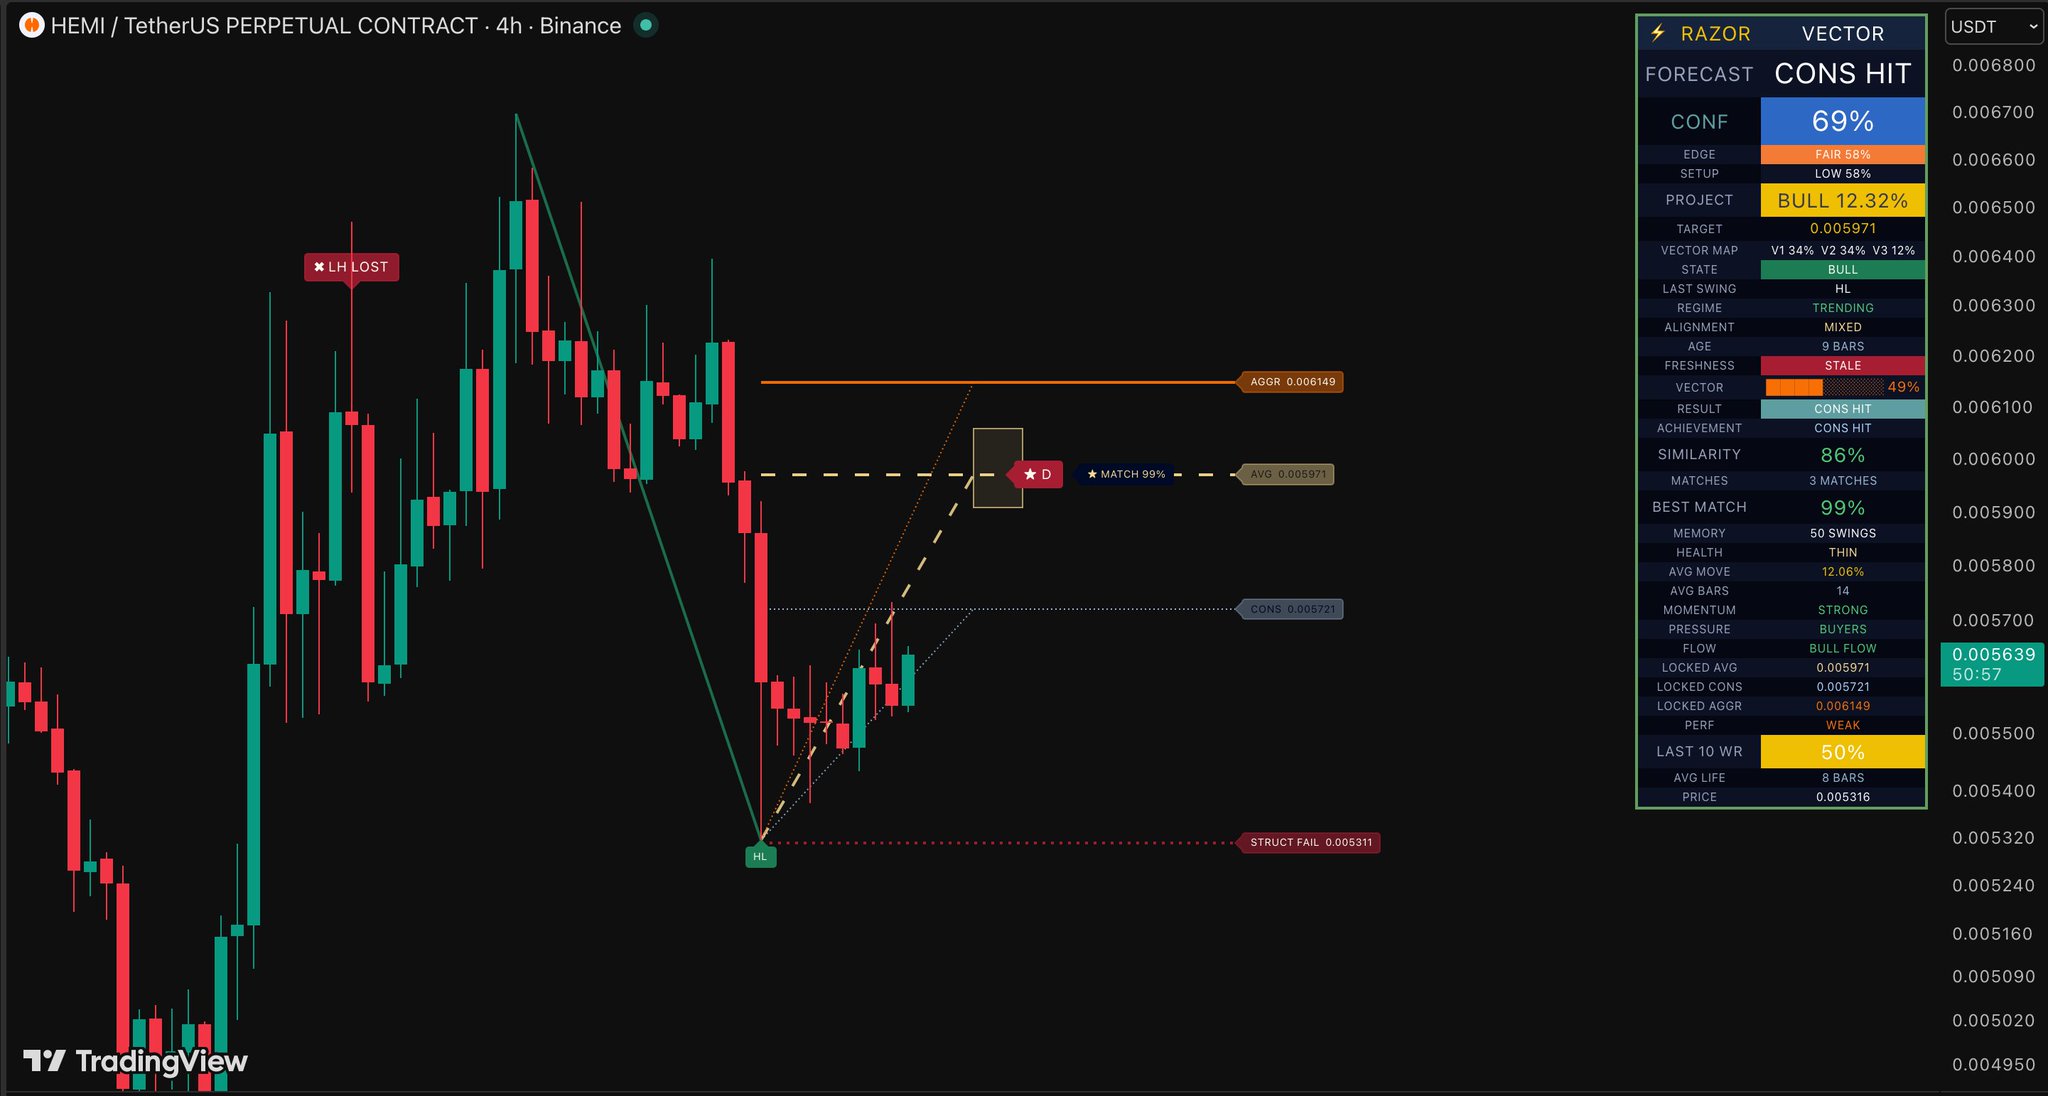
🧪 $HEMI 에 Razor Vector 테스트
Razor Vector를 사용하여 4시간 차트에서 $HEMI 를 첫 라이브로 살펴봅니다.
$HEMI가 평균 투영을 향해 계속 나아갈 수 있는지 확인해 봅시다. https://t.co/t1tXohKlNV


 269.6K @CryptoNewton
 🧪 $HEMI 에 Razor Vector 테스트
Razor Vector를 사용하여 4시간 차트에서 $HEMI 를 첫 라이브로 살펴봅니다.
$HEMI가 평균 투영을 향해 계속 나아갈 수 있는지 확인해 봅시다. https://t.co/t1tXohKlNV
 21
21
 1
1
 3.8K
269.6K @CryptoNewton
3.8K
269.6K @CryptoNewton $HEMI 👀 https://t.co/dqARspTsqR
 34
7
5.6K
34
7
5.6K
 9.3K @nocoffeenobrain
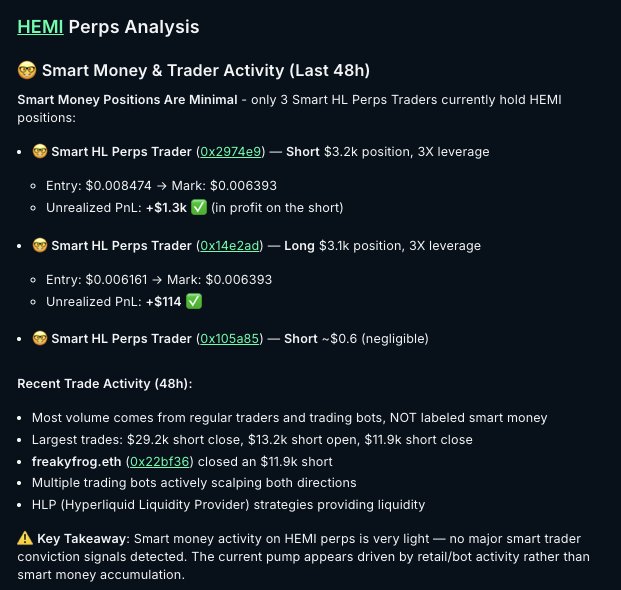
 오늘 일찍 $HEMI 알림을 받았어요
@nansen_ai를 열고 스마트 머니와 트레이더 활동을 확인했어요
강한 포지션을 보지 못했는데, 그게 저에게 좋은 신호예요
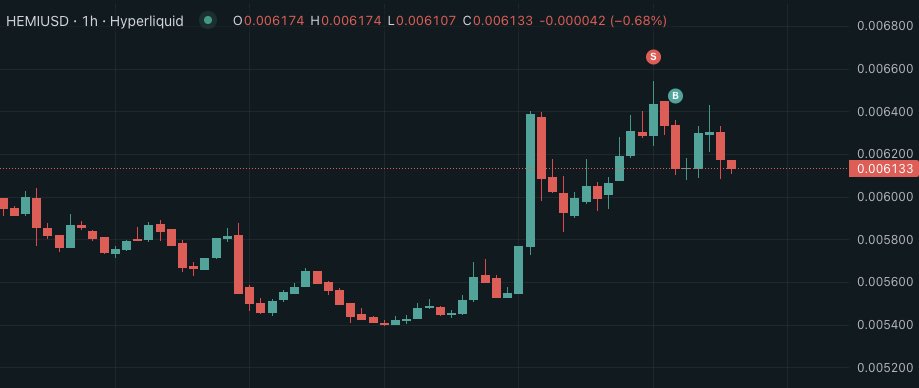
그래서 TP와 SL을 설정하고 3배 레버리지 숏을 열고 이번 일요일을 즐겼어요
방금 집에 도착했는데, TP가 달성됐어요
우린 모든 걸 잡을 필요는 없어요
규모가 어디인지 확인하고, 설정을 계획하면 충분해요
 7
2
249
7
2
249