
방금 **코드 없는 혁명이 왔습니다. 자동화되었습니다.**
#GraphLinq #NoCode #Blockchain #DeFi #Automation #Web3 #AI #GLQ
https://t.co/Q3T0k0lUzi
Rewards
Futures Daily Draw
100% Chance To Win With Daily Trades
현물 일일 추첨
Win 8,888 USDT In Grand Prizes
휴대폰 요금 충전
온라인으로 간편하고 안전하게 휴대폰 요금을 충전하세요.
Send
Send money globally, fast and secure
BitMart Mall
Live on crypto

Graphlinq Chain (GLQ)
$ 0.0024 (GLQ/USD)
-7.20%
24H
Graphlinq Chain Live Price data
Today's price of Graphlinq Chain Is $ 0.0024 (GLQ/USD). With A Market Cap Of $ 831.73K USD. 24-Hour Trading Volume Of $ 95,171.56 USD, A 24-Hour Price Change Of -7.20%, And A Circulating Supply Of 340.00M GLQ.
Graphlinq Chain GLQ Price History USD
Track the price of Graphlinq Chain for today, 7 days, 30 days and 90 days
기간
변경하기
Change (%)
오늘
$ 0.00018
-7.20%
7일
$ 0.00037
-13.19%
30일
$ 0.0014
-37.50%
90일
$ 0.0014
-36.87%
Own GLQ Now
Buy and sell GLQ easily and securely on BitMart.
Graphlinq Chain Market Information
$ 0.0024 24h Range $ 0.0026
All time high
$ 0.0084
All time low
$ 0.0024
24시간 변동률
-7.20%
24시간 거래량
$ 95,171.56
유통량
340.00M
GLQ
Market cap
$ 831.73K
Max supply
--
Fully diluted market cap
$ 1.59M
거래하기 GLQ
Graphlinq Chain X 인사이트

Crynet
미디어
연구원
D
 4.2K @crynetio
 상승세
GLQ가 코딩 없이 DeFi 자동화 플랫폼을 출시했습니다
 3
3
 1
1
 128
128
2025-11-15 16:14
GLQ의 출시 후 추세
상승세
GLQ가 코딩 없이 DeFi 자동화 플랫폼을 출시했습니다

Man of Bitcoin
기술 분석가
트레이더
B
9.3K @Manofbitcoin 상승세
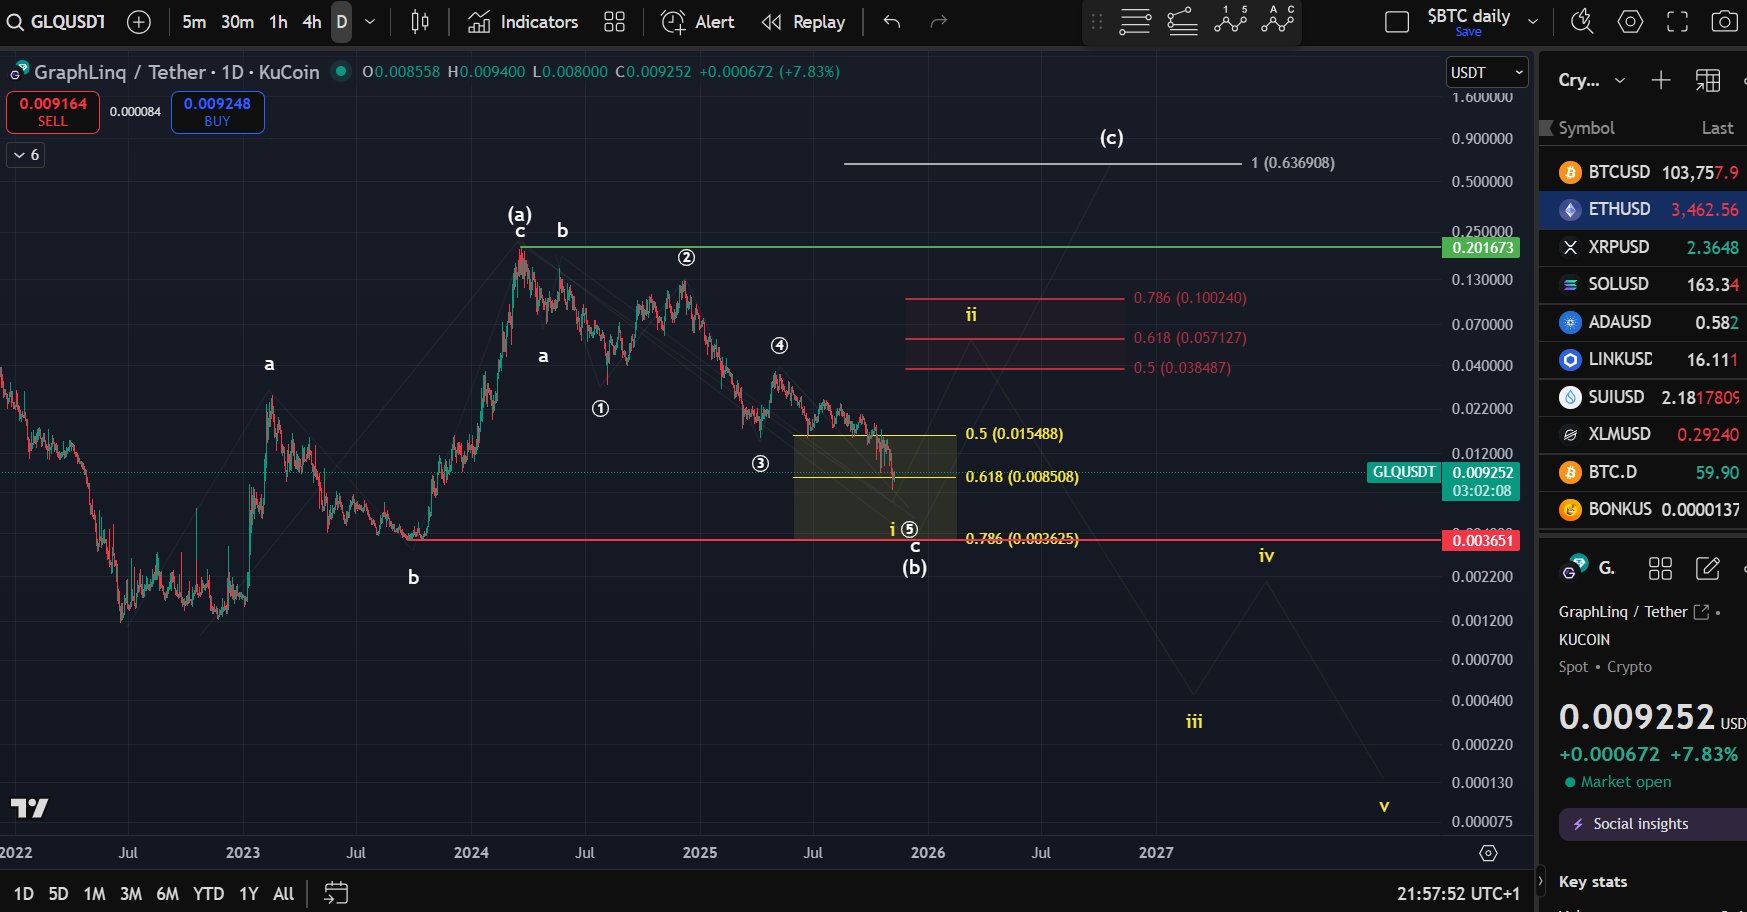
GLQ는 잠재적인 5파 하락 약세 시나리오에 직면해 있지만, 주요 저항 영역을 돌파할 경우 $0.6369를 목표로 하는 ABC 상승 조정이 나타날 수 있습니다.
$GLQ (요청에 따라): 잠재적인 5파 하락으로 인해 약세 시나리오가 추가되었습니다. 파동-ii 고점 저항은 $0.0384에서 $0.1002 사이에 있습니다.이 영역을 돌파하면 더 큰 ABC 조정이 상승 방향으로 전개될 수 있으며, 이상적인 목표는 $0.6369 근처입니다.
 8
1
1.3K
8
1
1.3K
2025-11-07 21:04
GLQ의 출시 후 추세
상승세
GLQ는 잠재적인 5파 하락 약세 시나리오에 직면해 있지만, 주요 저항 영역을 돌파할 경우 $0.6369를 목표로 하는 ABC 상승 조정이 나타날 수 있습니다.
Man of Bitcoin
기술 분석가
트레이더
B
9.3K @Manofbitcoin 매우 약세
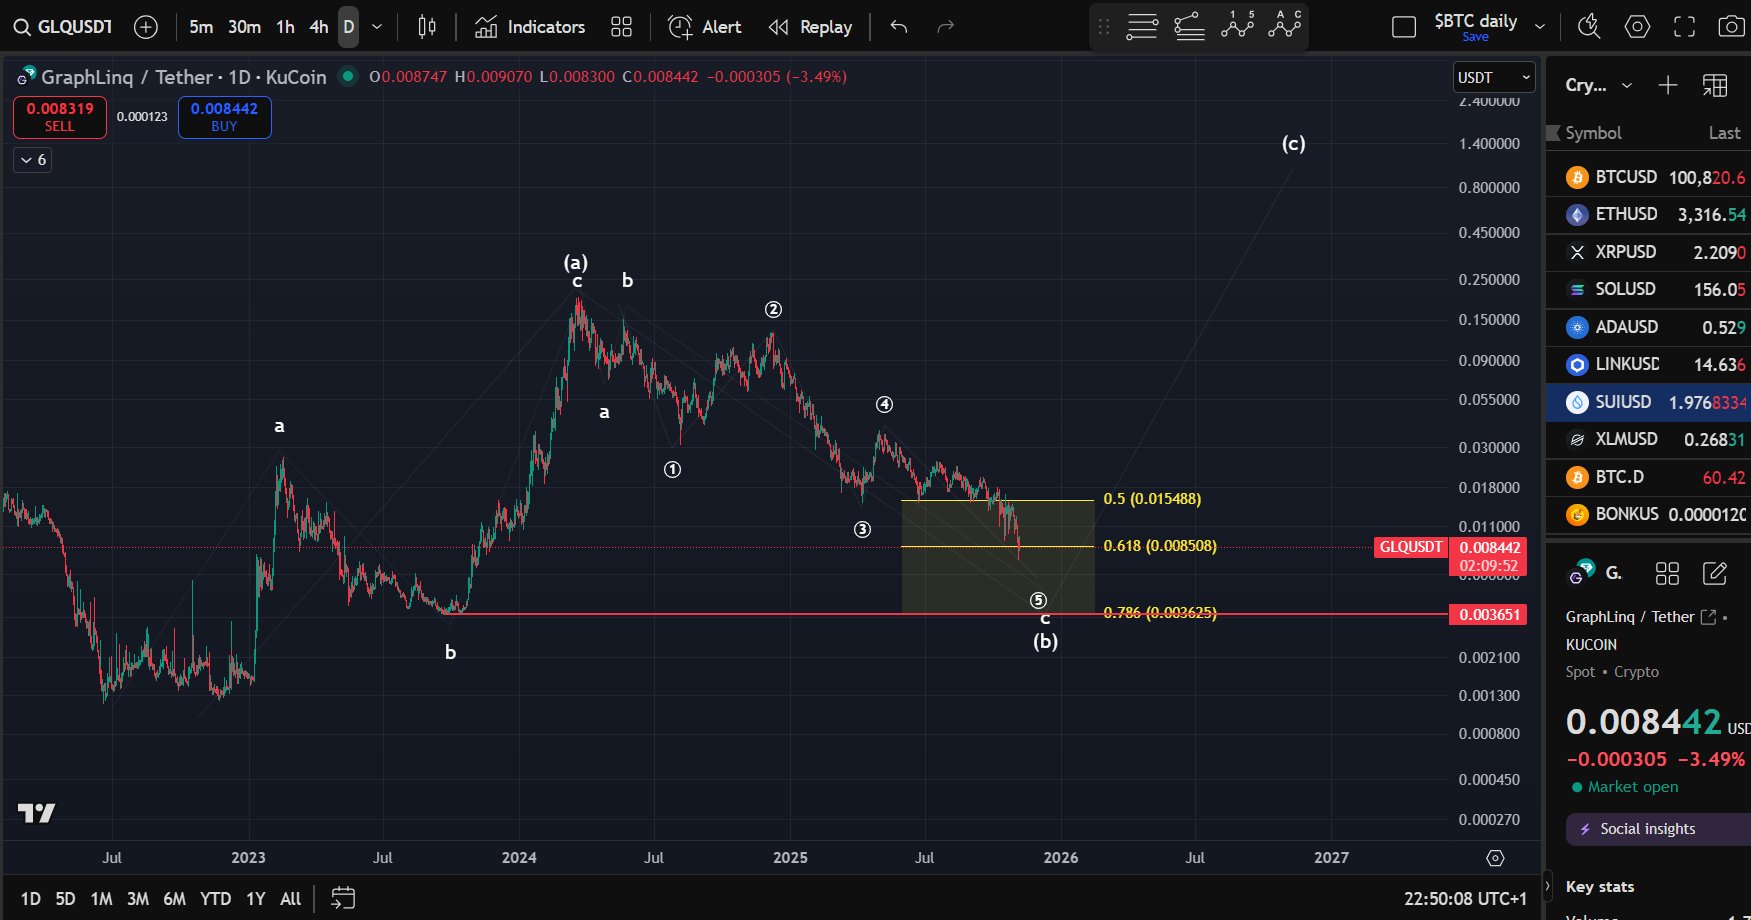
GLQ는 ABC 대각선 패턴을 형성할 수 있으며, 0.0085달러 피보나치 되돌림 수준에 도달했지만 반응이 약합니다. 지지선이 무너지면 0.00365달러가 잠재적인 반전 영역이 될 수 있습니다.
$GLQ: 가격은 큰 ABC 대각선 패턴을 형성하고 있을 수 있습니다. 이미 0.0085달러의 61.8% 피보나치 되돌림에 도달했지만, 현재까지의 반응은 신뢰하기에는 너무 약합니다.
만약 지지선이 무너지면, 0.00365달러 수준이 다음 잠재적 반전 영역이 될 수 있습니다. https://t.co/gUwzpKOUwG
 12
1
1.2K
12
1
1.2K
2025-11-06 21:54
GLQ의 출시 후 추세
하락세
GLQ는 ABC 대각선 패턴을 형성할 수 있으며, 0.0085달러 피보나치 되돌림 수준에 도달했지만 반응이 약합니다. 지지선이 무너지면 0.00365달러가 잠재적인 반전 영역이 될 수 있습니다.
가격 예측
When is a good time to buy GLQ? Should I buy or sell GLQ now?
When deciding whether it’s a good time to buy or sell Graphlinq Chain (GLQ), it’s important to first align with your own trading strategy and risk profile.Long-term investors and short-term traders often interpret market conditions differently, so your decision should reflect your personal approach. According to the latest GLQ 4-hour technical analysis, the current trading signal is Hold. According to the latest GLQ 1-day technical analysis, the current signal is Hold.

Beacon Prediction
Probabilistic Price Forecast (Next 24 Hours)Beacon Prediction Disclaimer
The data results displayed on this page are analyzed based on actual trading data (OHLCV) of the selected trading pair along with corresponding technical indicators.
This prediction is an experimental technical product and is provided for reference purposes only. It does not constitute investment advice. Unexpected real-world events may significantly impact market behavior. Traders should make decisions with caution.
This prediction is an experimental technical product and is provided for reference purposes only. It does not constitute investment advice. Unexpected real-world events may significantly impact market behavior. Traders should make decisions with caution.
소개 Graphlinq Chain
Graphlinq Chain (GLQ) is a cryptocurrency launched in 2021. Graphlinq Chain has a current supply of 650,000,000 with 339,999,895 in circulation. The last known price of Graphlinq Chain is 0.00277001 USD and is down -0.25 over the last 24 hours. It is currently trading on 52 active market(s) with $68,080.17 traded over the last 24 hours. More information can be found at https://graphlinq.io/.
자세히 읽어보기
Chain Explorer
Explore More
BM 디스커버리


새 리스팅

NES Nesa
-- 0.00%

HIVEON HIVE Digital Technologies
-- 0.00%

SOXSON Direxion Daily Semi Bear 3X ETF
-- 0.00%

TON AT&T Tokenized Stock (Ondo)
-- 0.00%

KEELON Keel Infrastructure
-- 0.00%

DRAMON Roundhill Memory ETF
-- 0.00%

JAM JAM Coin
-- 0.00%

UMXM Manadia
-- 0.00%

UMCON United Microelectronics Tokenized Stock (Ondo)
-- 0.00%

AMKRON Amkor Technology Tokenized Stock (Ondo)
-- 0.00%