$ZETA is quietly setting up for what could be a very nice move in the coming weeks
Stay ready
Not financial advice
Rewards
Futures Daily Draw
100% Chance To Win With Daily Trades
現物の日次のドロー
Win 8,888 USDT In Grand Prizes
ステークして投票
投票してエアドロップを獲得
機関
プロなかつ専門的なサービス対応
BitMart VIP
限定報酬のロック解除
アカデミー
トレードとブロックチェーンについて
BitMart Internship
Start your Crypto Career Here
BitMart Travel
ワンストップグローバルトラベルサービス
モバイルチャージ
モバイルを簡単に、オンラインで、安全にチャージ
Send
Send money globally, fast and secure
BitMartモール
Live on crypto

ZetaChain (ZETA)
$ 0.039 (ZETA/USD)
0.00%
24H
ZetaChain ライブ価格データ
ZetaChainの今日の価格は$ 0.039 (ZETA/USD)です。 時価総額$ 58.38M USD、 24時間取引量$ 3.35M USD、 24時間の価格変動+0.00%、 そして流通供給量1.46B ZETA。
ZetaChain ZETA 価格履歴 USD
ZetaChainの今日、7日間、30日間、90日間の価格を追跡
期間
24H変動幅
24H変動率 (%)
本日
$ 0
0.00%
7日
$ 0
0.00%
30日
$ 0.0099
-20.00%
90日
$ 0.0099
-20.00%
ZETAを今すぐ所有
BitMartでZETAを簡単に安全に売買できます。
ZetaChain 相場情報
$ 0.039 24H変動幅 $ 0.039
過去最高値
$ 0.099
過去最安値
$ 0.029
24H変動幅
0.00%
24H取引高
$ 3,347,384.29
供給量
1.46B
ZETA
時価総額
$ 58.38M
最大供給量
2.10B
ZETA
完全希薄化後時価総額
$ 83.90M
取引 ZETA
ZetaChain Xインサイト

StockChaser
TA_Analyst
Trader
A
 27.3K @StockChaser_
 強気
ZETA is expected to show a strong move, recommended to watch
 28
28
 4
4
 3.1K
3.1K
2026-06-20 22:12
リリース後のZETAのトレンド
強気
ZETA is expected to show a strong move, recommended to watch

The Defiant
Media
Influencer
D
363.4K @DefiantNews 強気
ZetaChain focuses on the user memory layer, enhancing AI privacy and interoperability, worth attention.
Your AI knows more about you than anyone else, and most of that data lives on servers you don’t control.
@ZetaChain is betting the next AI wave won’t be bigger models, but user-owned memory: one encrypted context layer that travels across models.
Privacy, portability, and AI interoperability in one stack.
Read [media partner]:
https://t.co/BR8MRcgU6e
3
1
1.6K
2026-06-18 18:37
リリース後のZETAのトレンド
強気
ZetaChain focuses on the user memory layer, enhancing AI privacy and interoperability, worth attention.

Kevin
TA_Analyst
FA_Analyst
C
24.5K @Kev_Capital_TA 強気
ZETA bullish backtests key support level; if held, it may form a golden cross and continue rising.
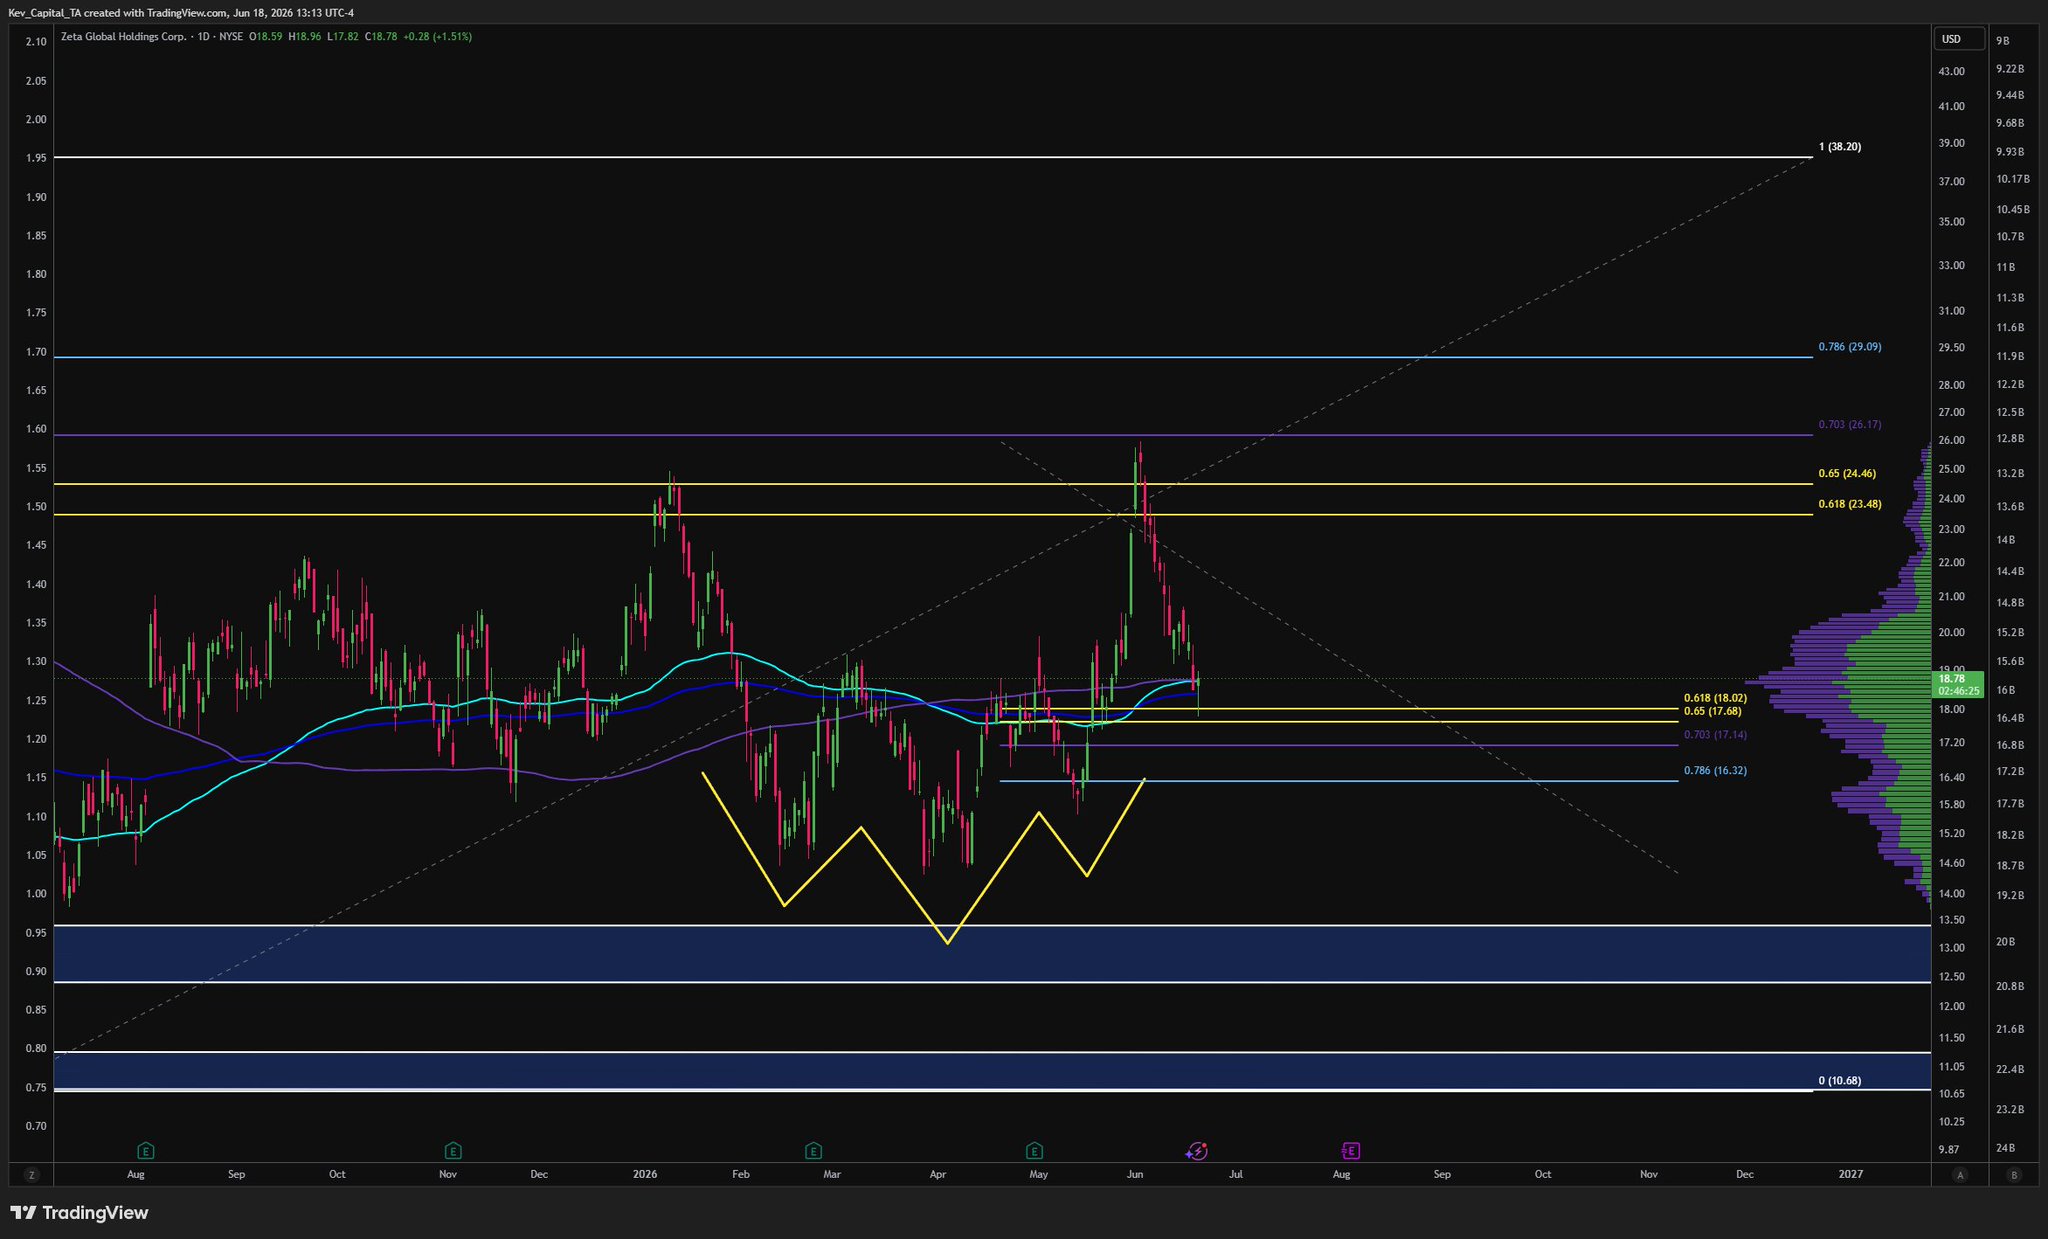
$ZETA Global TA
ZETA recently tested the key $18-$16 range along with the 200D EMA/SMA.
This is still a bullish backtest of the original inverse H&S breakout pattern we identified weeks ago.
The $18-$16 zone is crucial to hold. If it breaks below, ZETA may revert to accumulation.
If it holds, a bullish continuation could push it back toward the significant $23-$29 resistance zone.
Kevin
TA_Analyst
FA_Analyst
C
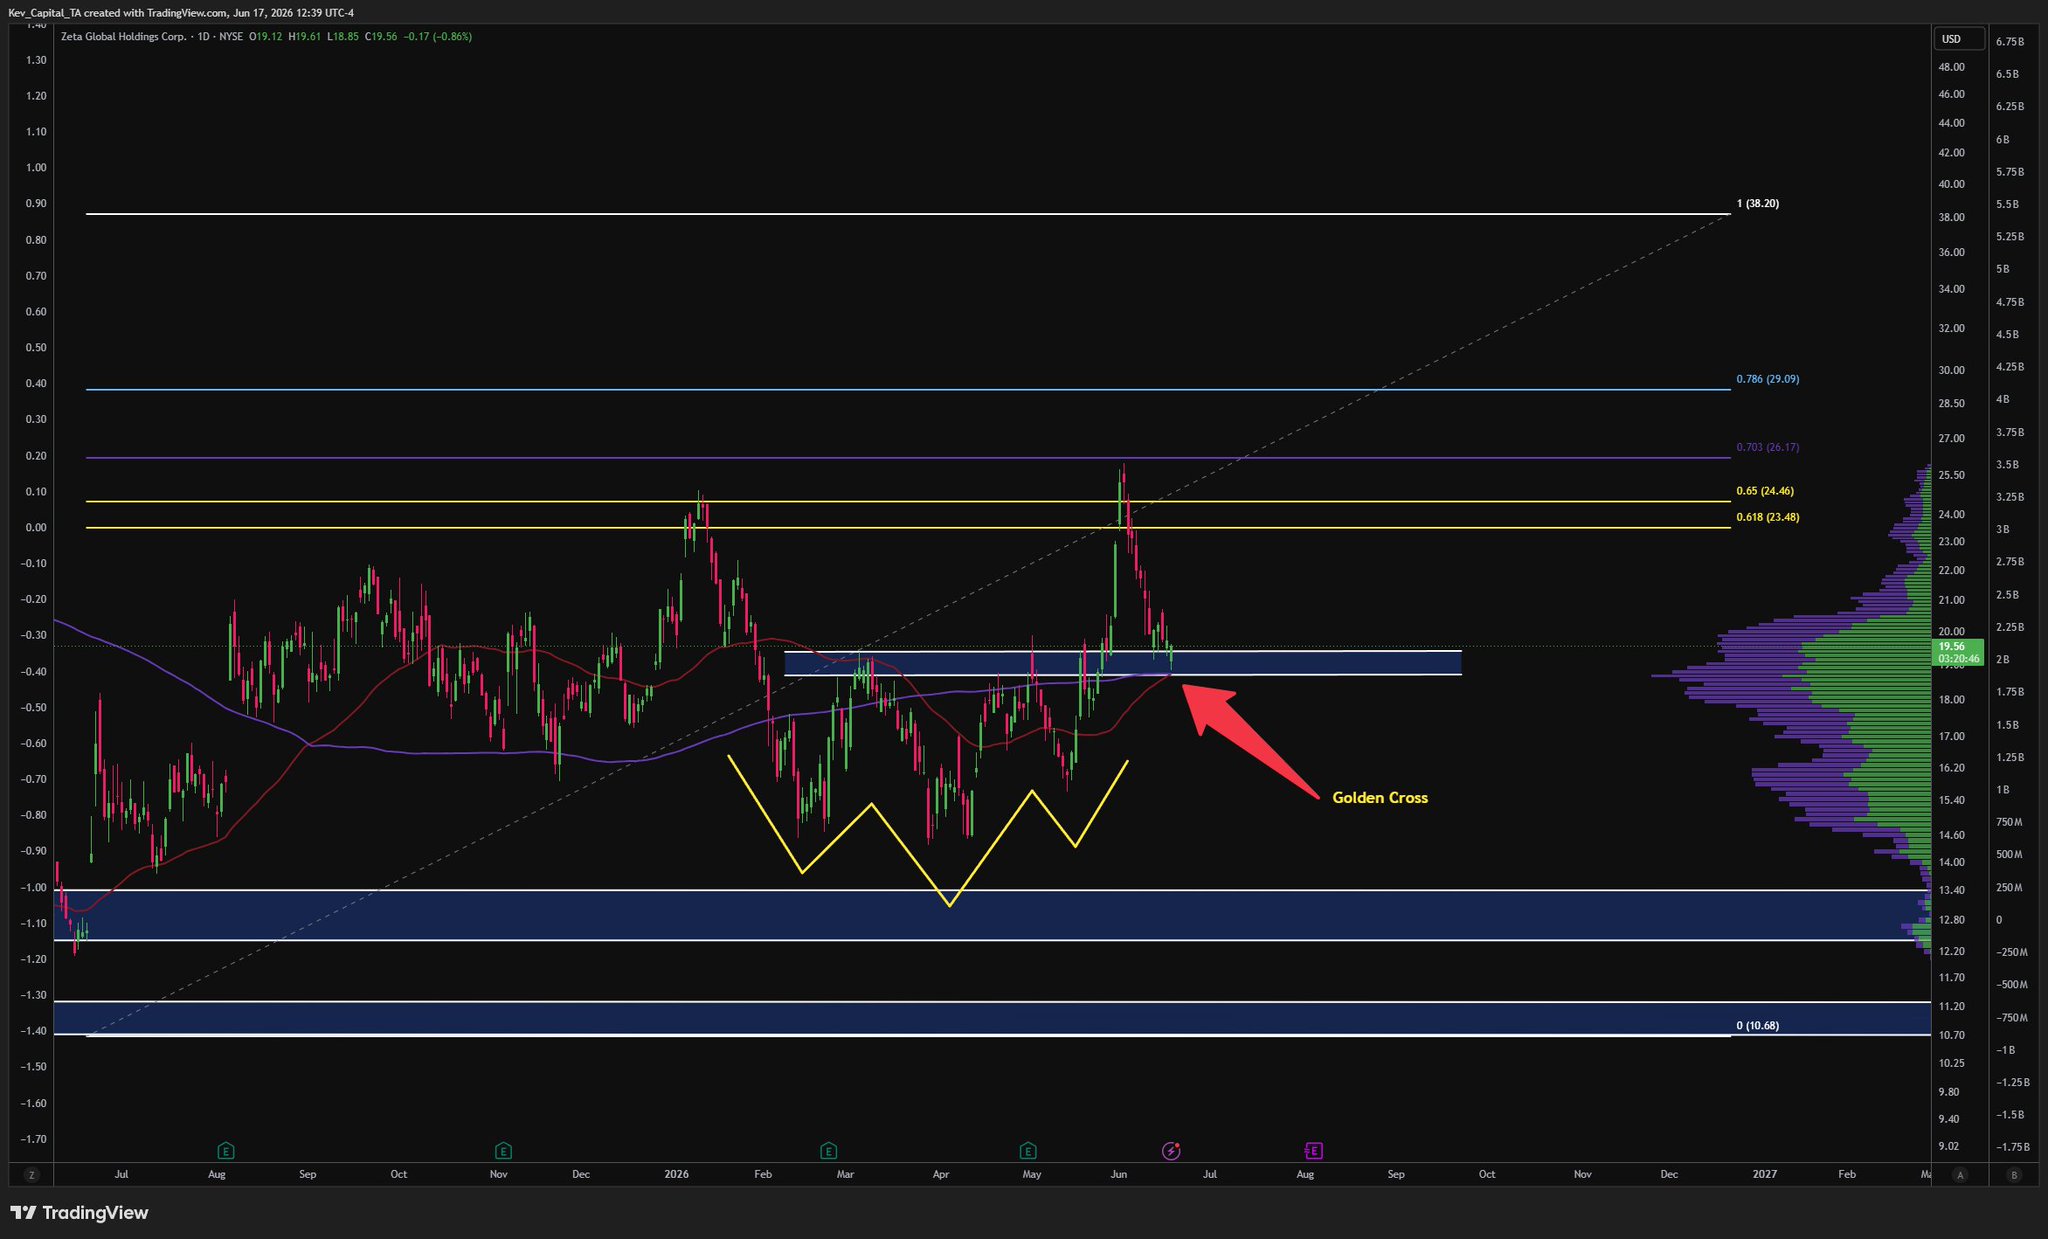
24.5K @Kev_Capital_TA $ZETA Global holders, this is for you.
After breaking out of the inverse H&S pattern I called a week early and then reaching my exact measured move target zone between $23-$29, Zeta is now experiencing a bullish pullback to the neckline of the inverse H&S pattern.
However, something else to watch closely is that while this retest is happening, we're about to see a daily timeframe bullish golden cross at this exact support zone. Pullbacks into golden crosses are completely normal, and the current structure remains bullish.
If Zeta can hold this $20-$18 zone, we will see higher prices. Anything below that zone, and we could be back into accumulation.
 21
1
3.2K
21
1
3.2K
2026-06-18 17:37
リリース後のZETAのトレンド
強気
ZETA bullish backtests key support level; if held, it may form a golden cross and continue rising.
価格予測
ZETAを購入するのに良い時期はいつですか?ZETAは今買いでしょうか、売りでしょうか?
ZetaChain(ZETA)を購入または売却する適切な時期を決定する際は、まずご自身の取引戦略とリスクプロファイルに合わせることが重要です。長期投資家と短期トレーダーは市場状況を異なる方法で解釈することが多いため、決定には個人的なアプローチを反映すべきです。 最新の ZETA 4時間テクニカル分析によると、現在の取引シグナルは ホールド です。 最新のZETA1日テクニカル分析によると、現在のシグナルはホールドです。

ビーコン予測
の確率的価格予測(今後24時間)ビーコン予測に関する免責事項
このページに表示されるデータ結果は、選択した取引ペアの実際の取引データ(OHLCV)と対応するテクニカル指標に基づいて分析されています。
この予測は実験的な技術的成果であり、あくまで参考目的で提供しています。これは投資アドバイスをではありません。現実世界での予期せぬ出来事が市場行動に大きな影響を与える可能性があります。トレーダーは慎重に意思決定を行うべきです。
この予測は実験的な技術的成果であり、あくまで参考目的で提供しています。これは投資アドバイスをではありません。現実世界での予期せぬ出来事が市場行動に大きな影響を与える可能性があります。トレーダーは慎重に意思決定を行うべきです。
アプリバージョン ZetaChain
ZetaChain (ZETA) is a cryptocurrency launched in 2021and operates on the Ethereum platform. ZetaChain has a current supply of 2,100,000,000 with 1,461,177,083 in circulation. The last known price of ZetaChain is 0.03946365 USD and is up 2.33 over the last 24 hours. It is currently trading on 181 active market(s) with $4,946,295.59 traded over the last 24 hours. More information can be found at https://zetachain.com.
続きを読む