spot long $GRT for this 4th wave https://t.co/AviCFhCENU


 25.0K @Michael_EWpro
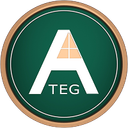
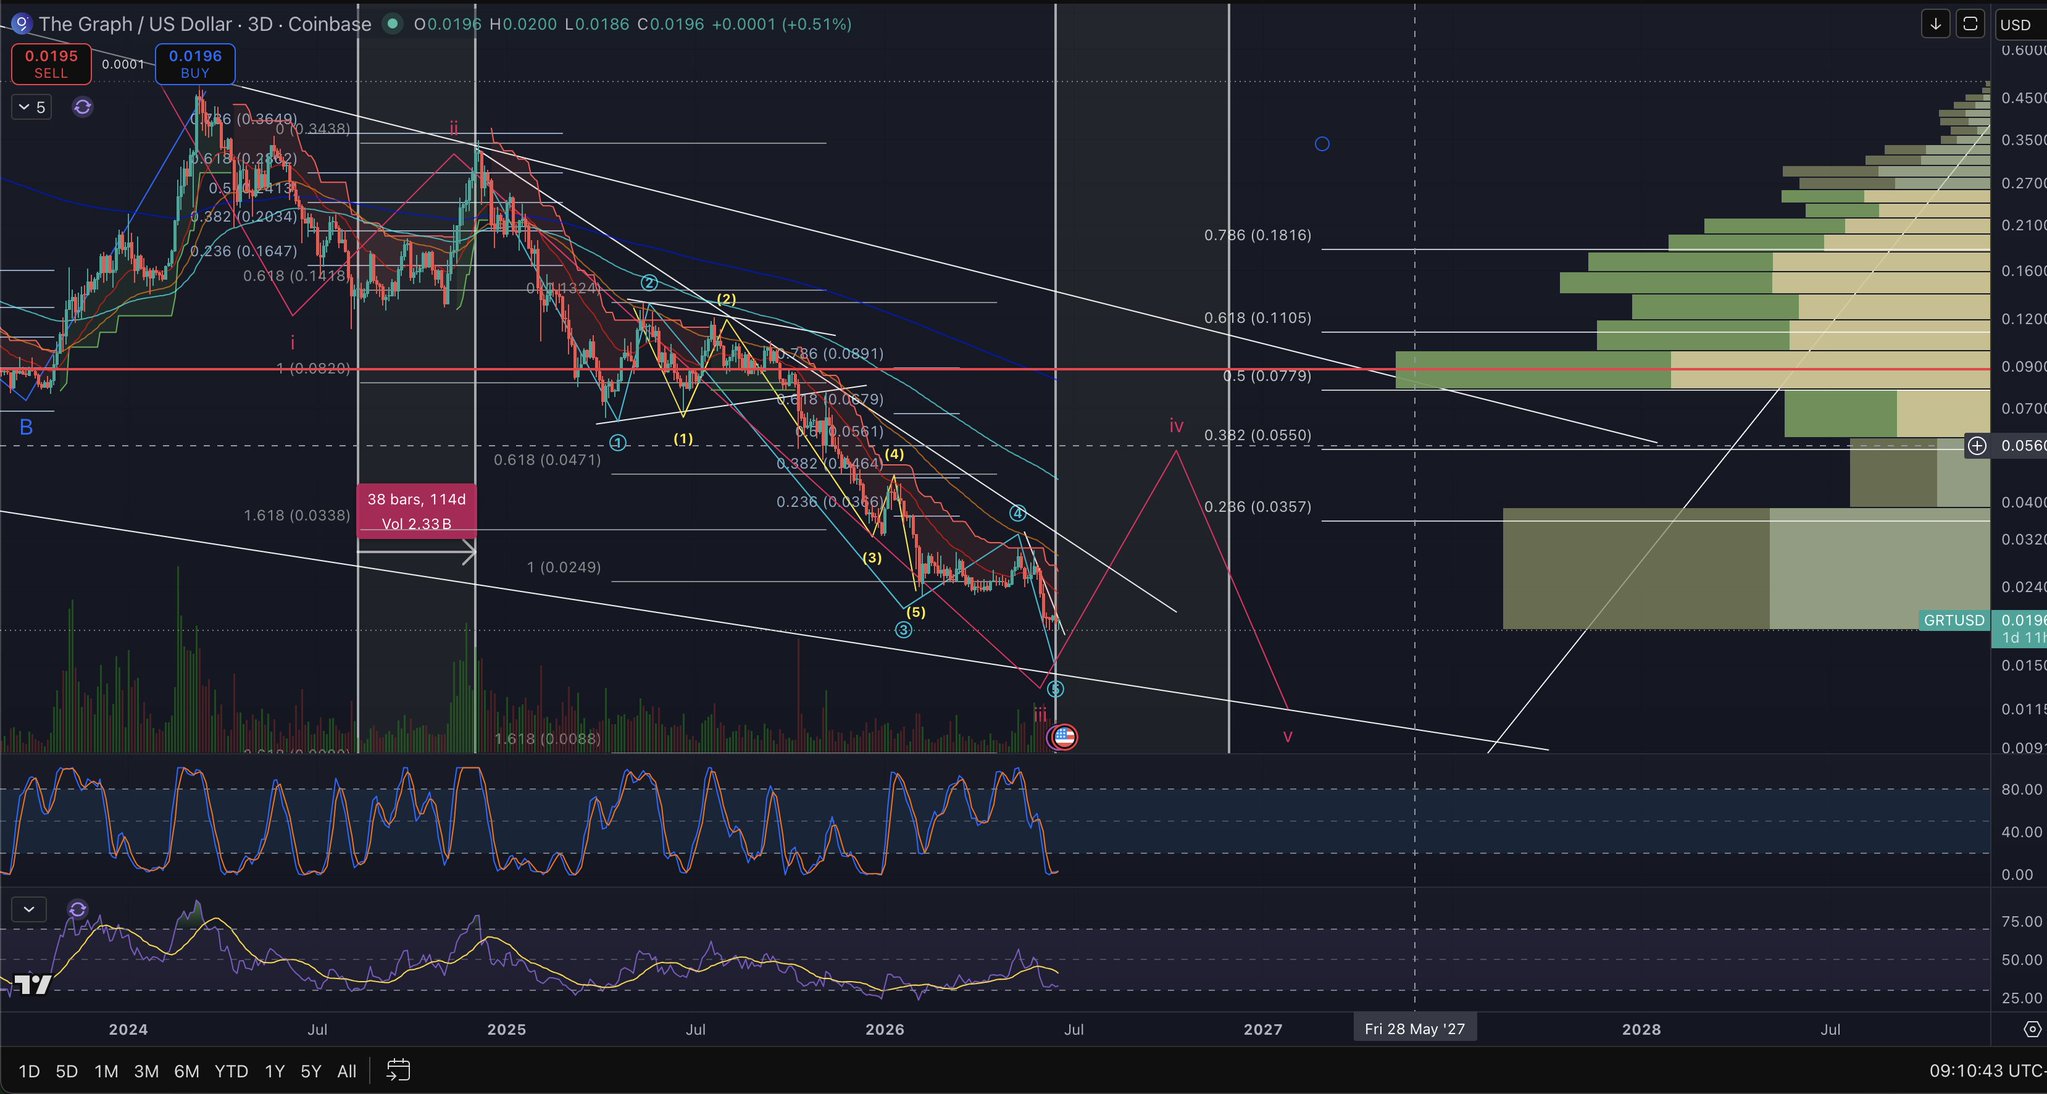
 spot long $GRT for this 4th wave https://t.co/AviCFhCENU
 10
10
 1
1
 1.7K
1.7K
 83.2K @BlocksterCom
  340.5K @graphprotocol
 The reason enterprise adoption moves slowly is not skepticism about the technology. It is the gap between what blockchain can do and what regulated institutions are allowed to touch.
SOC-2 compliance. Verified node operators. Auditable data.
"The Graph's roadmap seeks to address that, and I'm super optimistic that The Graph will be part of that conversation." - Nick, Team Lead
118
11
11.0K
25.0K @Michael_EWpro looks like a possible running or irregular flat on ethereum:0xc944e90c64b2c07662a292be6244bdf05cda44a7 H4 https://t.co/iHNLGq6wJI
 25.0K @Michael_EWpro
 Next up 20 bands into ethereum:0xc944e90c64b2c07662a292be6244bdf05cda44a7 let the haters keep fading me and ima keep winning
8
2
2.3K