口座開設
QRコードでアプリをダウンロードする
iOS & Android

Render (RENDER)

$
$ 1.27 (RENDER/USD)
1.60%
24H

Render ライブ価格データ

Renderの今日の価格は$ 1.27 (RENDER/USD)です。 時価総額$ 658.32M USD 24時間取引量$ 28.31M USD 24時間の価格変動+1.60% そして流通供給量518.77M RENDER

Render RENDER 価格履歴 USD

Renderの今日、7日間、30日間、90日間の価格を追跡
期間
24H変動幅
24H変動率 (%)
本日
$ 0.019
1.60%
7日
--
--
30日
--
--
90日
--
--

RENDERを今すぐ所有

BitMartでRENDERを簡単に安全に売買できます。
今すぐRENDERを購入/売却
今すぐ{0}を購入/売却
Render 相場情報
最終取引価格 $ 1.27
$ 1.23 24H変動幅 $ 1.27
過去最高値
‎$ 0‎
過去最安値
‎$ 0‎
24H変動幅
‎1.60%‎
24H取引高
‎$ 28,306,770.30‎
供給量
0.51B RENDER
時価総額
‎$ 658.32M‎
最大供給量
0.64B RENDER
完全希薄化後時価総額
‎$ 817.44M‎
取引 RENDER

稼ぐ

眠っている暗号資産を活用し、セービングやステーキングで安定収益を獲得。
今すぐ試す
今すぐ試す

Render Xインサイト

avatar
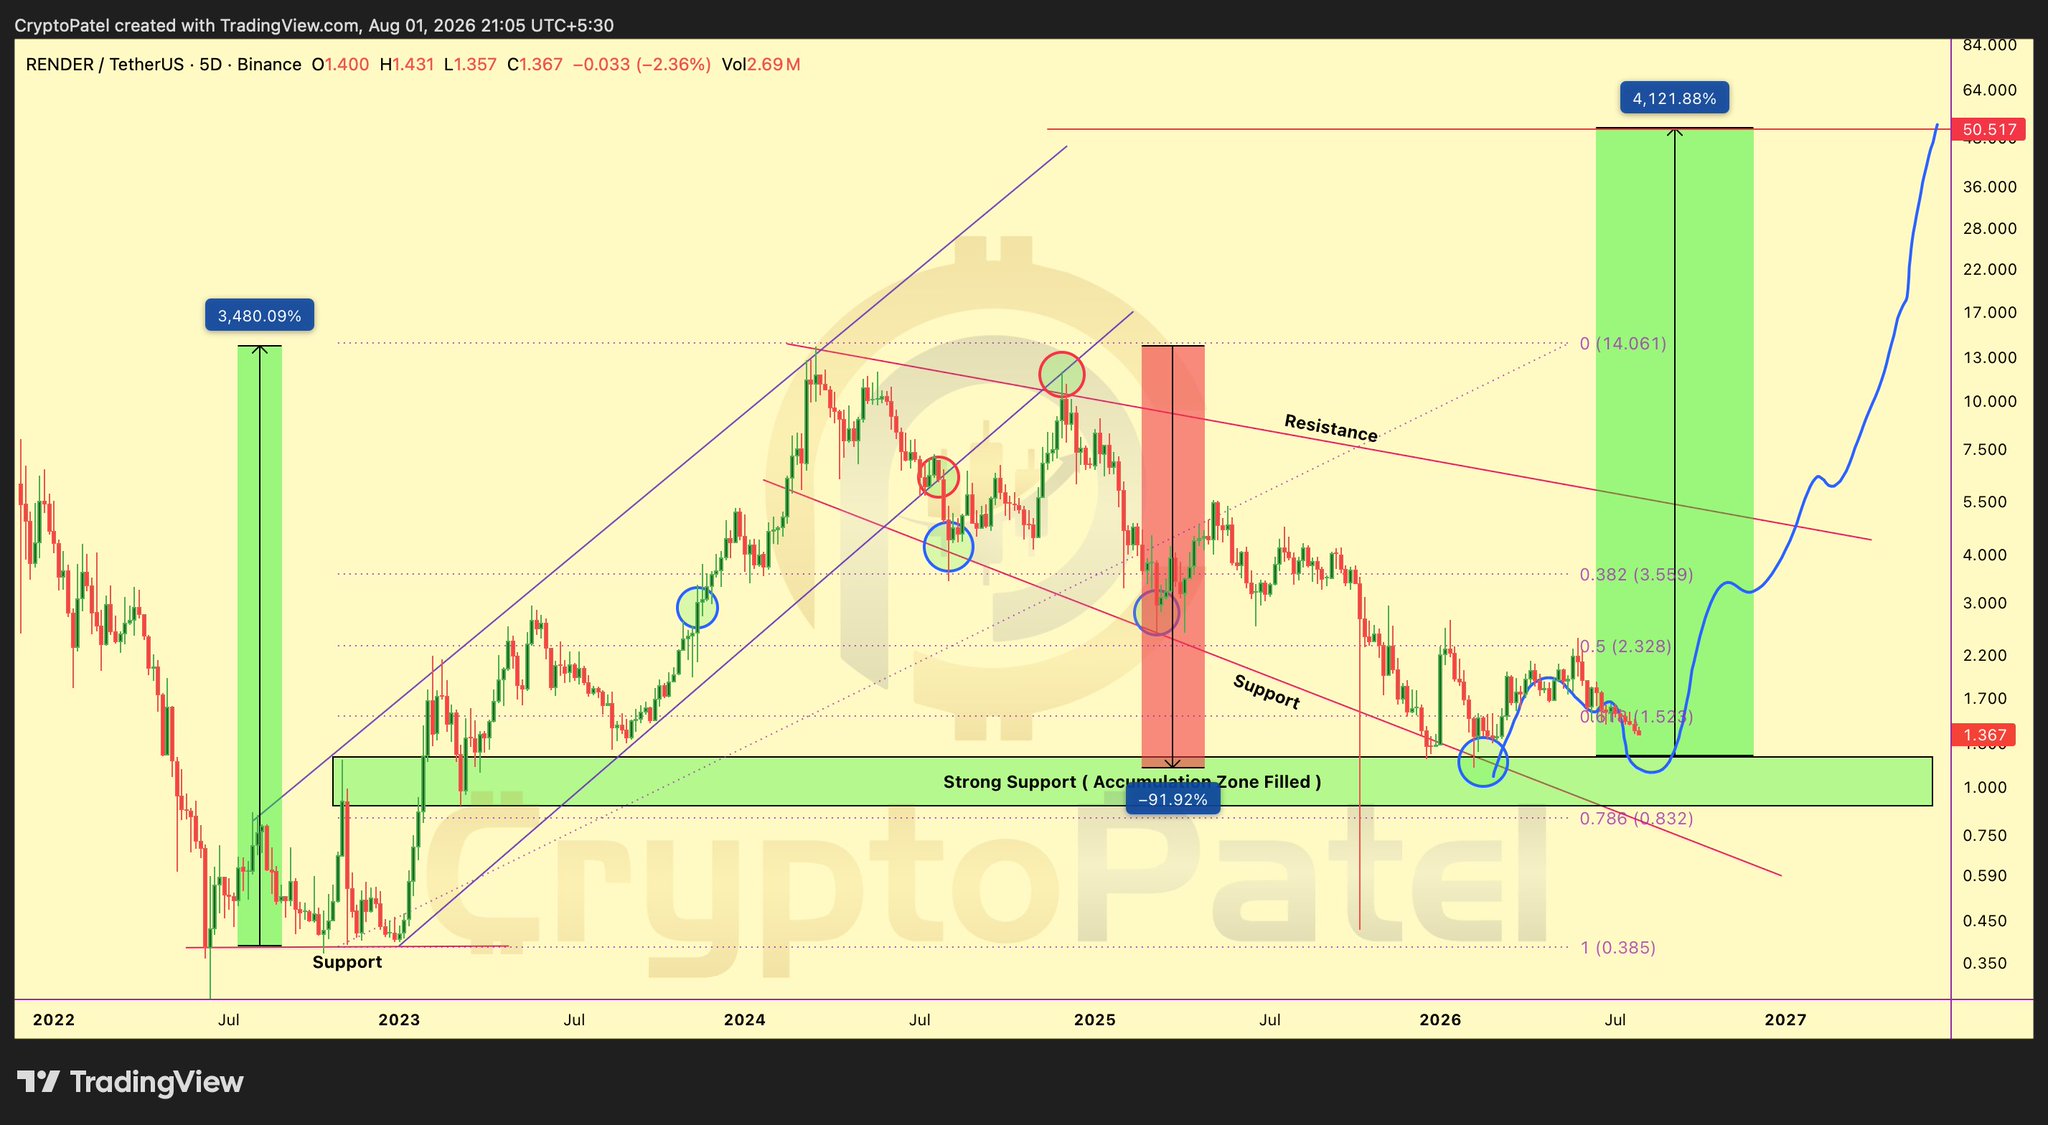
RENDER is in an accumulation zone, with limited downside and huge upside potential, target price $10-$50.

$RENDER is back in the same HTF Accumulation zone that fueled its previous parabolic rally

After a 92%+ correction, downside looks increasingly limited while the upside remains massive. If this support holds, the next major move could catch most people completely off guard. 🚀

Accumulation Zone: $1.35-$0.90
Targets: $10 | $20 | $30 | $50
Stop Loss: HTF Close Below $0.70

NFA & Always DYOR

@render
view 282
view 23
view 31.2K
2026-08-02 05:37
リリース後のRENDERのトレンド
非常に強気
RENDER is in an accumulation zone, with limited downside and huge upside potential, target price $10-$50.
avatar
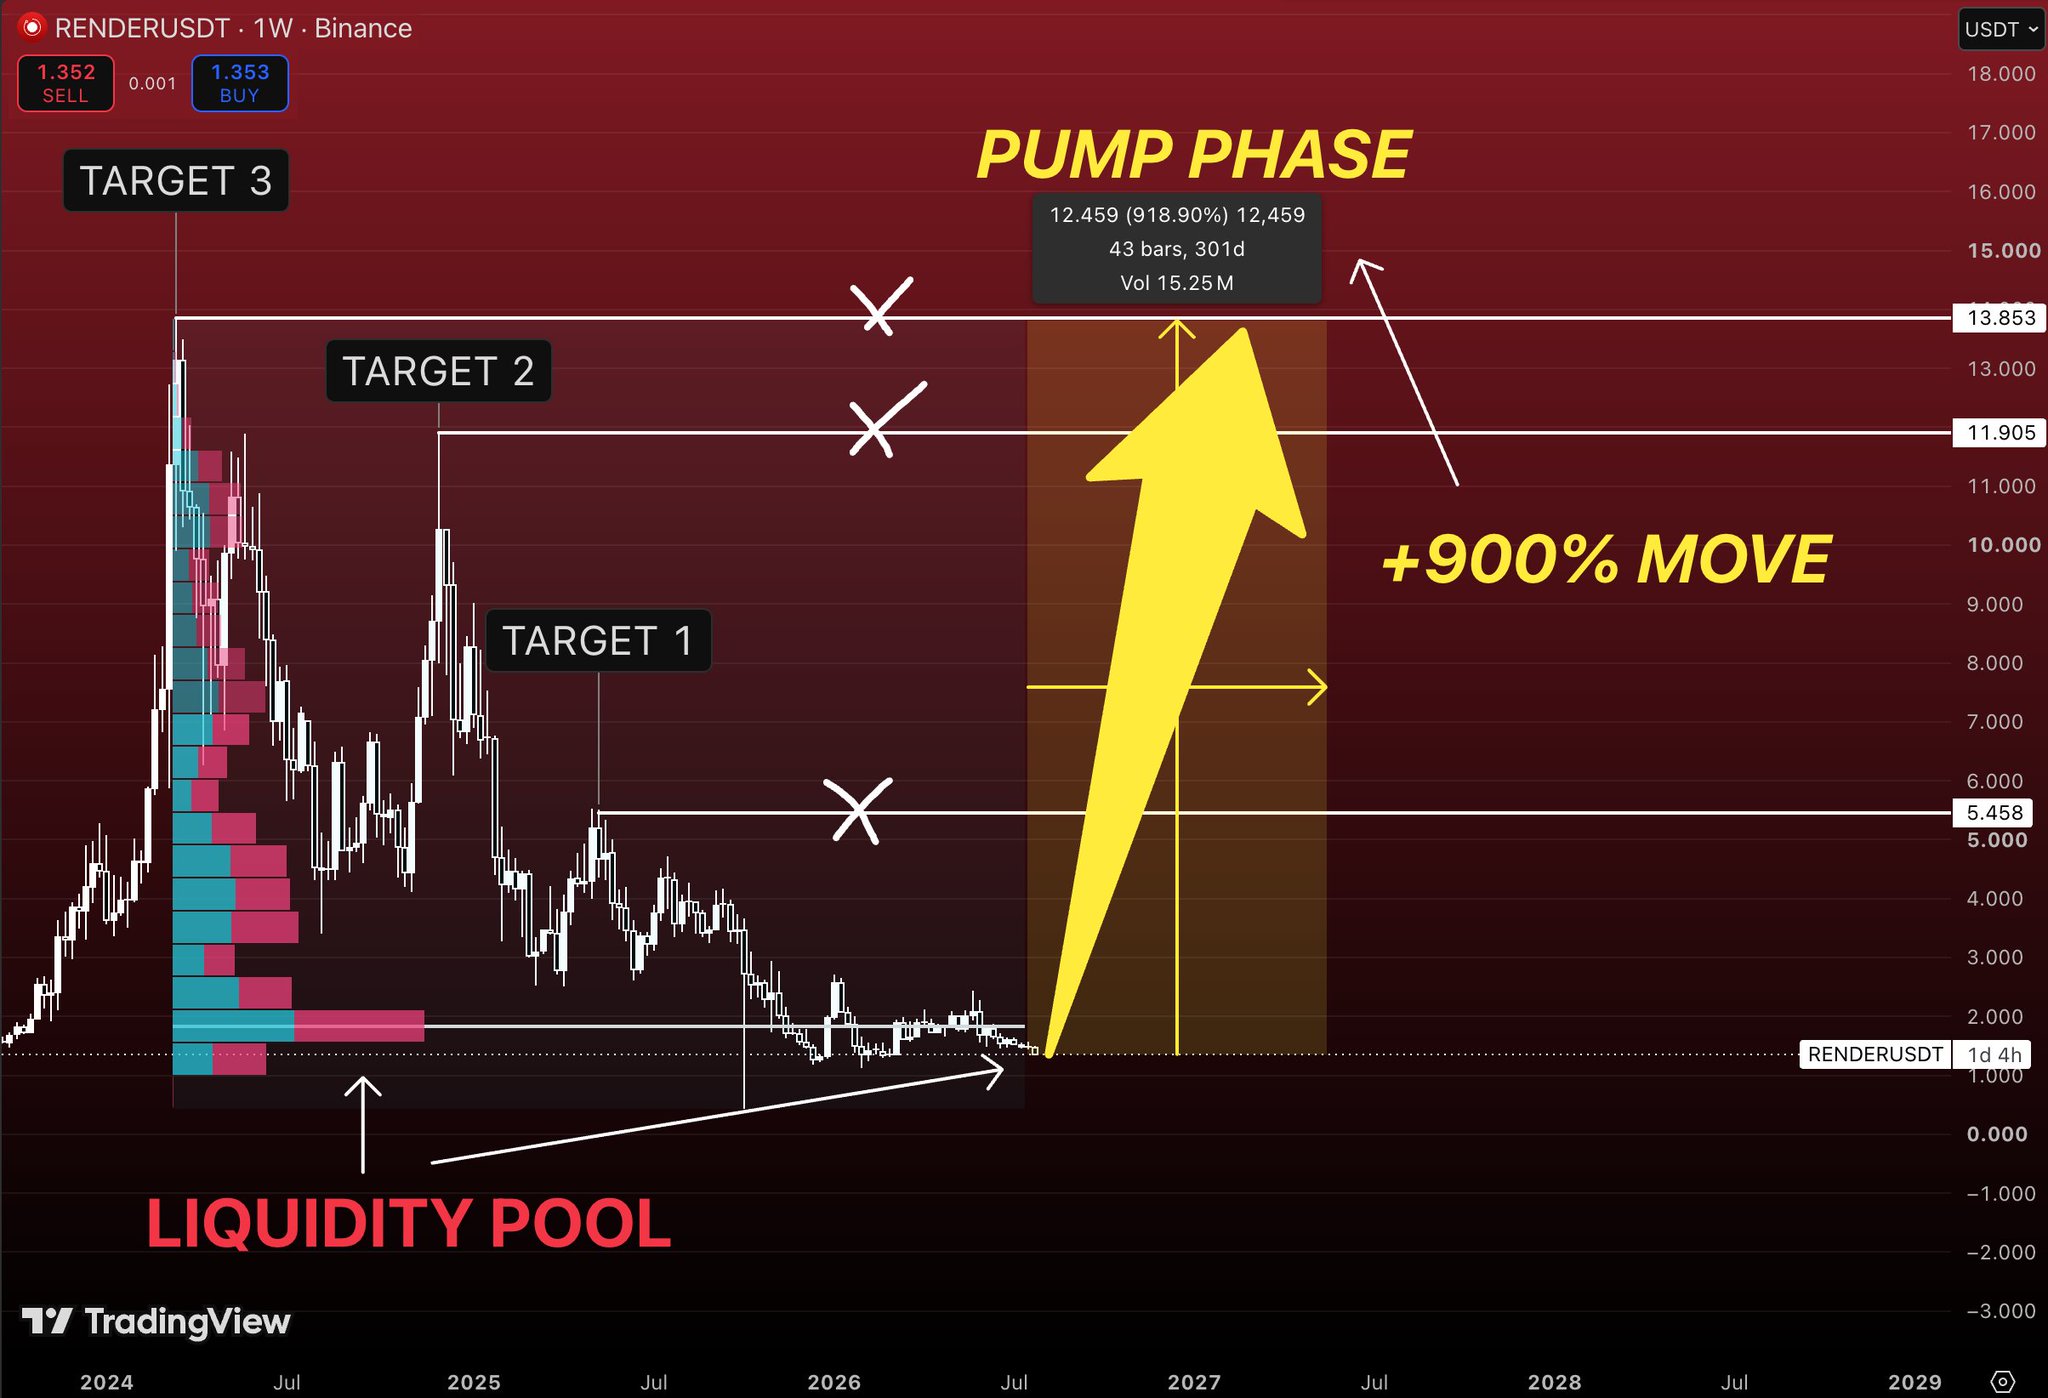
RENDER has completed its bottoming phase, expected to see a 900% rise, target price $13.8.

$RENDER has spent more than a year doing one thing.\n\nBuilding a base while everyone was chasing other narratives.\n\nMost traders see a chart that’s gone nowhere.\n\nLong-term investors see something completely different.\n\nA market that has already gone through its correction and has spent months transferring coins from impatient hands to patient ones.\n\nThat’s usually how the strongest trends begin.\n\nNot with excitement.\n\nWith boredom.\n\nOne thing immediately stands out on this chart.\n\nThe largest volume profile sits almost exactly where price is trading today.\n\nThat tells us this isn’t random consolidation.\n\nThis is where the majority of long-term positions have been built.\n\nAs long as that liquidity zone continues to hold, the bullish structure remains intact.\n\nThe first real objective sits around $5.45.\n\nIt’s the first major resistance where the previous cycle left behind significant supply.\n\nA breakout above that level would confirm that buyers have regained control of the larger trend.\n\nAbove it, the next destination becomes $11.9.\n\nThat’s where market psychology begins to shift.\n\nInvestors who ignored the move suddenly start paying attention, while those who sold near the lows begin chasing higher prices.\n\nMomentum usually accelerates once that process starts.\n\nThe final target sits near $13.8, close to the previous cycle highs.\n\nIf $RENDER manages to reclaim that area, the market enters price discovery once again.\n\nThat’s where trends often become much stronger than most people initially expect.\n\nThe interesting part isn’t the projected 900% move.\n\nIt’s the amount of time the market has spent preparing for it.\n\nBig trends rarely start after vertical rallies.\n\nThey usually start after months of silence.\n\nAfter everyone loses interest.\n\nAfter volatility disappears.\n\nThat’s exactly what this chart has been doing.\n\nIf AI narratives continue attracting capital during the next cycle\n\n$RENDER is already sitting in the kind of structure that has historically produced some of the strongest recoveries.\n\nThe hardest part isn’t buying these charts.\n\nIt’s believing in them while almost nobody else does.

view 17
view 0
view 799
2026-08-01 20:37
リリース後のRENDERのトレンド
非常に強気
RENDER has completed its bottoming phase, expected to see a 900% rise, target price $13.8.
avatar
RNDR在关键支撑位1.20美元附近盘整,作者认为当前是理想入场点,未来有望上涨。

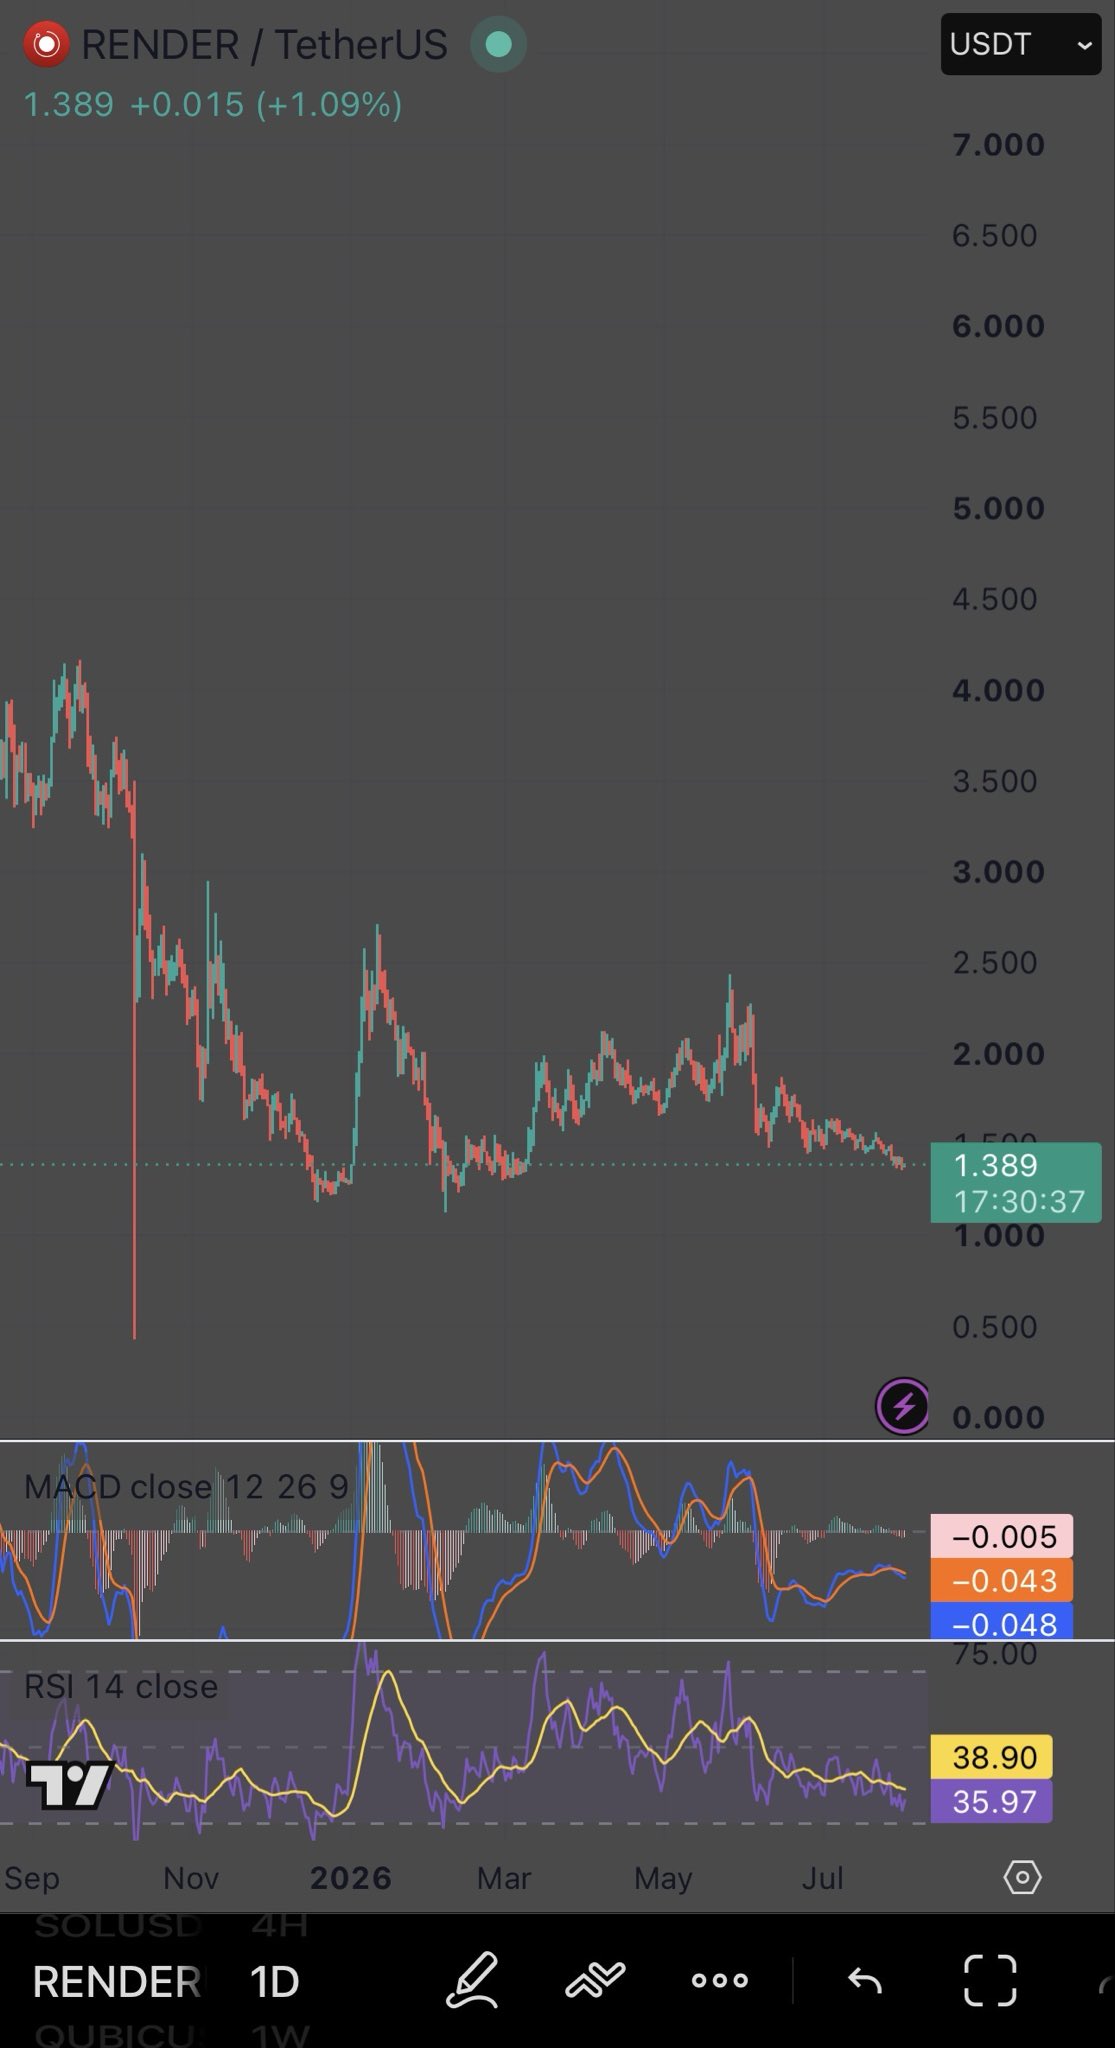
solana:rndrizKT3MK1iimdxRdWabcF7Zg7AR5T4nud4EkHBof fell 67% from its cycle high and the crowd stopped caring.

That is exactly when the chart starts telling the truth.

Price is back at 1.389, sitting on the same floor it defended all through last winter.

One number decides the next move:

1.20

Hold that base and this is a coiled decentralized GPU network with real rendering and AI compute demand behind it.

Lose it and the next honest support sits far below at 1.00.

Momentum is not screaming reversal yet.

RSI near 36 is weak but not oversold, and MACD is trying to curl without confirming.

That is a market catching its breath, not one turning.

Here is the part most people miss.

The best entries never feel safe.

They feel exactly like this, quiet and heavy and boring, while everyone waits for a green candle to hand them permission.

The people who mark 1.20 tonight will not need permission tomorrow.

Save this before it moves.

view 81
view 17
view 4.1K
2026-08-01 06:47
リリース後のRENDERのトレンド
強気
RNDR在关键支撑位1.20美元附近盘整,作者认为当前是理想入场点,未来有望上涨。
詳細確認

価格予測

RENDERを購入するのに良い時期はいつですか?RENDERは今買いでしょうか、売りでしょうか?

Render(RENDER)を購入または売却する適切な時期を決定する際は、まずご自身の取引戦略とリスクプロファイルに合わせることが重要です。長期投資家と短期トレーダーは市場状況を異なる方法で解釈することが多いため、決定には個人的なアプローチを反映すべきです。 最新の RENDER 4時間テクニカル分析によると、現在の取引シグナルは ホールド です。
52
ホールド
RENDERの4時間テクニカル分析
最終更新 2026-08-11 23:59:59
beacon

ビーコン予測

の確率的価格予測(今後24時間)
i
ビーコン予測に関する免責事項
このページに表示されるデータ結果は、選択した取引ペアの実際の取引データ(OHLCV)と対応するテクニカル指標に基づいて分析されています。
この予測は実験的な技術的成果であり、あくまで参考目的で提供しています。これは投資アドバイスをではありません。現実世界での予期せぬ出来事が市場行動に大きな影響を与える可能性があります。トレーダーは慎重に意思決定を行うべきです。
アプリバージョン Render
Render (RENDER) is a cryptocurrency launched in 2019and operates on the Ethereum platform. Render has a current supply of 533,532,274.56269149 with 518,772,101.28269149 in circulation. The last known price of Render is 1.29691625 USD and is down -2.28 over the last 24 hours. It is currently trading on 656 active market(s) with $13,949,045.61 traded over the last 24 hours. More information can be found at https://rendernetwork.com/.
続きを読む
購入 RENDER
取引 RENDER