Rewards
Futures Daily Draw
100% Chance To Win With Daily Trades
現物の日次のドロー
Win 8,888 USDT In Grand Prizes
ステークして投票
投票してエアドロップを獲得
機関
プロなかつ専門的なサービス対応
BitMart VIP
限定報酬のロック解除
アカデミー
トレードとブロックチェーンについて
BitMart Internship
Start your Crypto Career Here
BitMart Travel
ワンストップグローバルトラベルサービス
モバイルチャージ
モバイルを簡単に、オンラインで、安全にチャージ
Send
Send money globally, fast and secure
BitMartモール
Live on crypto

RAI Finance (SOFI)
$ 0.000049 (SOFI/USD)
0.00%
24H
RAI Finance ライブ価格データ
RAI Financeの今日の価格は$ 0.000049 (SOFI/USD)です。 時価総額$ 29,874.37 USD、 24時間取引量$ 0 USD、 24時間の価格変動+0.00%、 そして流通供給量598.31M SOFI。
RAI Finance SOFI 価格履歴 USD
RAI Financeの今日、7日間、30日間、90日間の価格を追跡
期間
24H変動幅
24H変動率 (%)
本日
$ 0
0.00%
7日
$ 0.0000099
25.00%
30日
$ 0.000039
400.00%
90日
$ 0.000019
66.67%
SOFIを今すぐ所有
BitMartでSOFIを簡単に安全に売買できます。
RAI Finance 相場情報
$ 0.000049 24H変動幅 $ 0.000049
過去最高値
$ 0.00010
過去最安値
$ 0.0000051
24H変動幅
0.00%
24H取引高
$ 0
供給量
0.59B
SOFI
時価総額
$ 29,874.37
最大供給量
--
完全希薄化後時価総額
$ 49,931.56
取引 SOFI

RAI Finance Xインサイト

chad.
TA_Analyst
Trader
B
 21.3K @chad_ventures
 強気
SOFI faces strong resistance at $19, and a breakout could lead to an upside move.
chad.
TA_Analyst
Trader
B
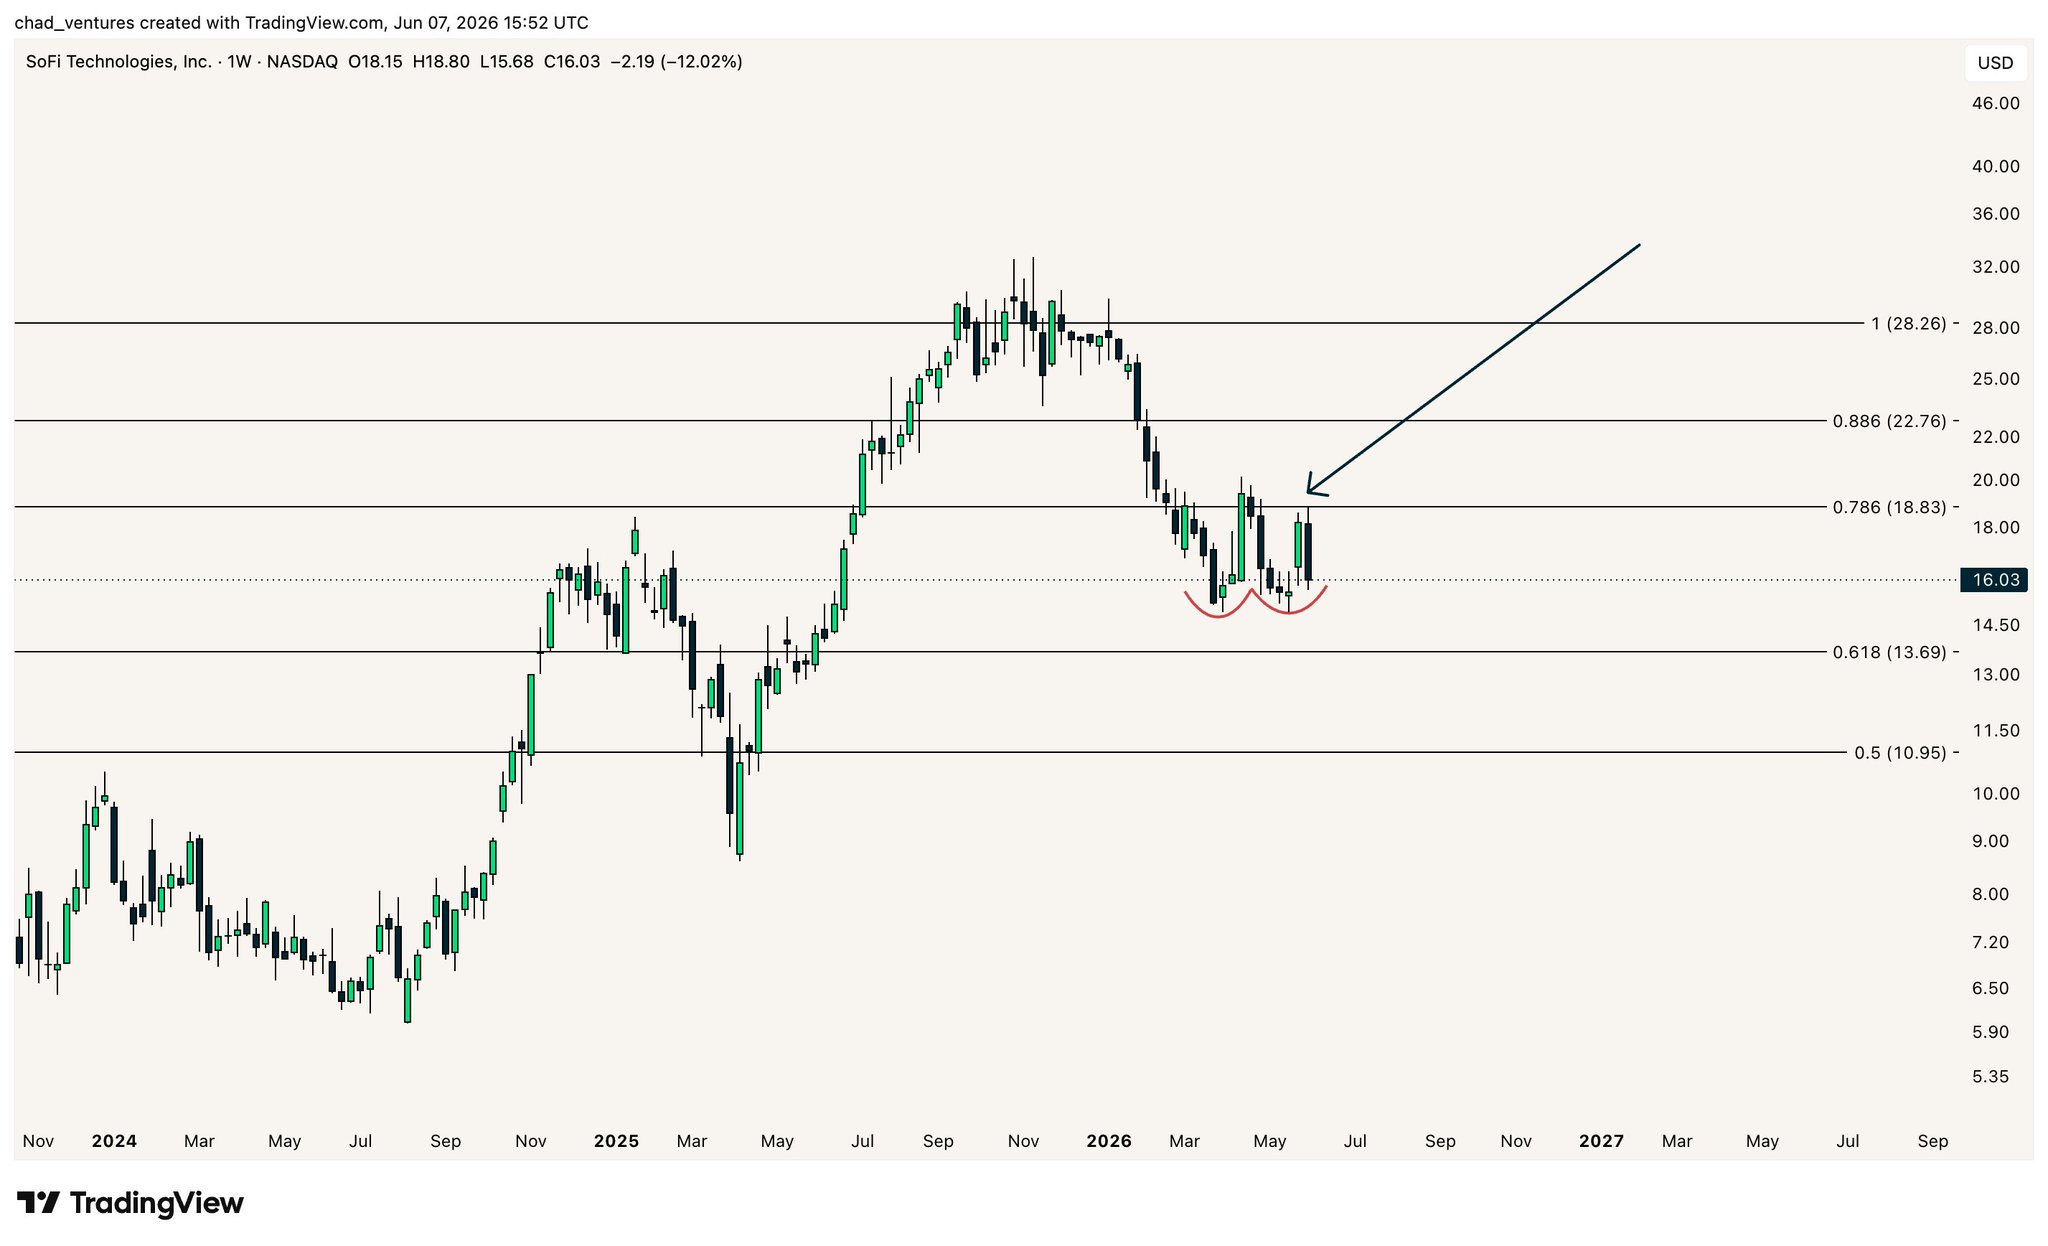
21.3K @chad_ventures $SOFI weekly
One more point of confluence regarding the strong resistance area around $19 is the 0.786 log Fibonacci level
Thus, $19 really is the main level to reclaim for more positive price action to occur again https://t.co/z9Mxk23nB9
 103
103
 4
4
 19.5K
19.5K
2026-06-07 23:17
リリース後のSOFIのトレンド
強気
SOFI faces strong resistance at $19, and a breakout could lead to an upside move.
chad.
TA_Analyst
Trader
B
21.3K @chad_ventures 強気
SOFI monthly chart forms a bullish cup‑handle pattern, structure intact, short‑term sentiment is weak.
chad.
TA_Analyst
Trader
B
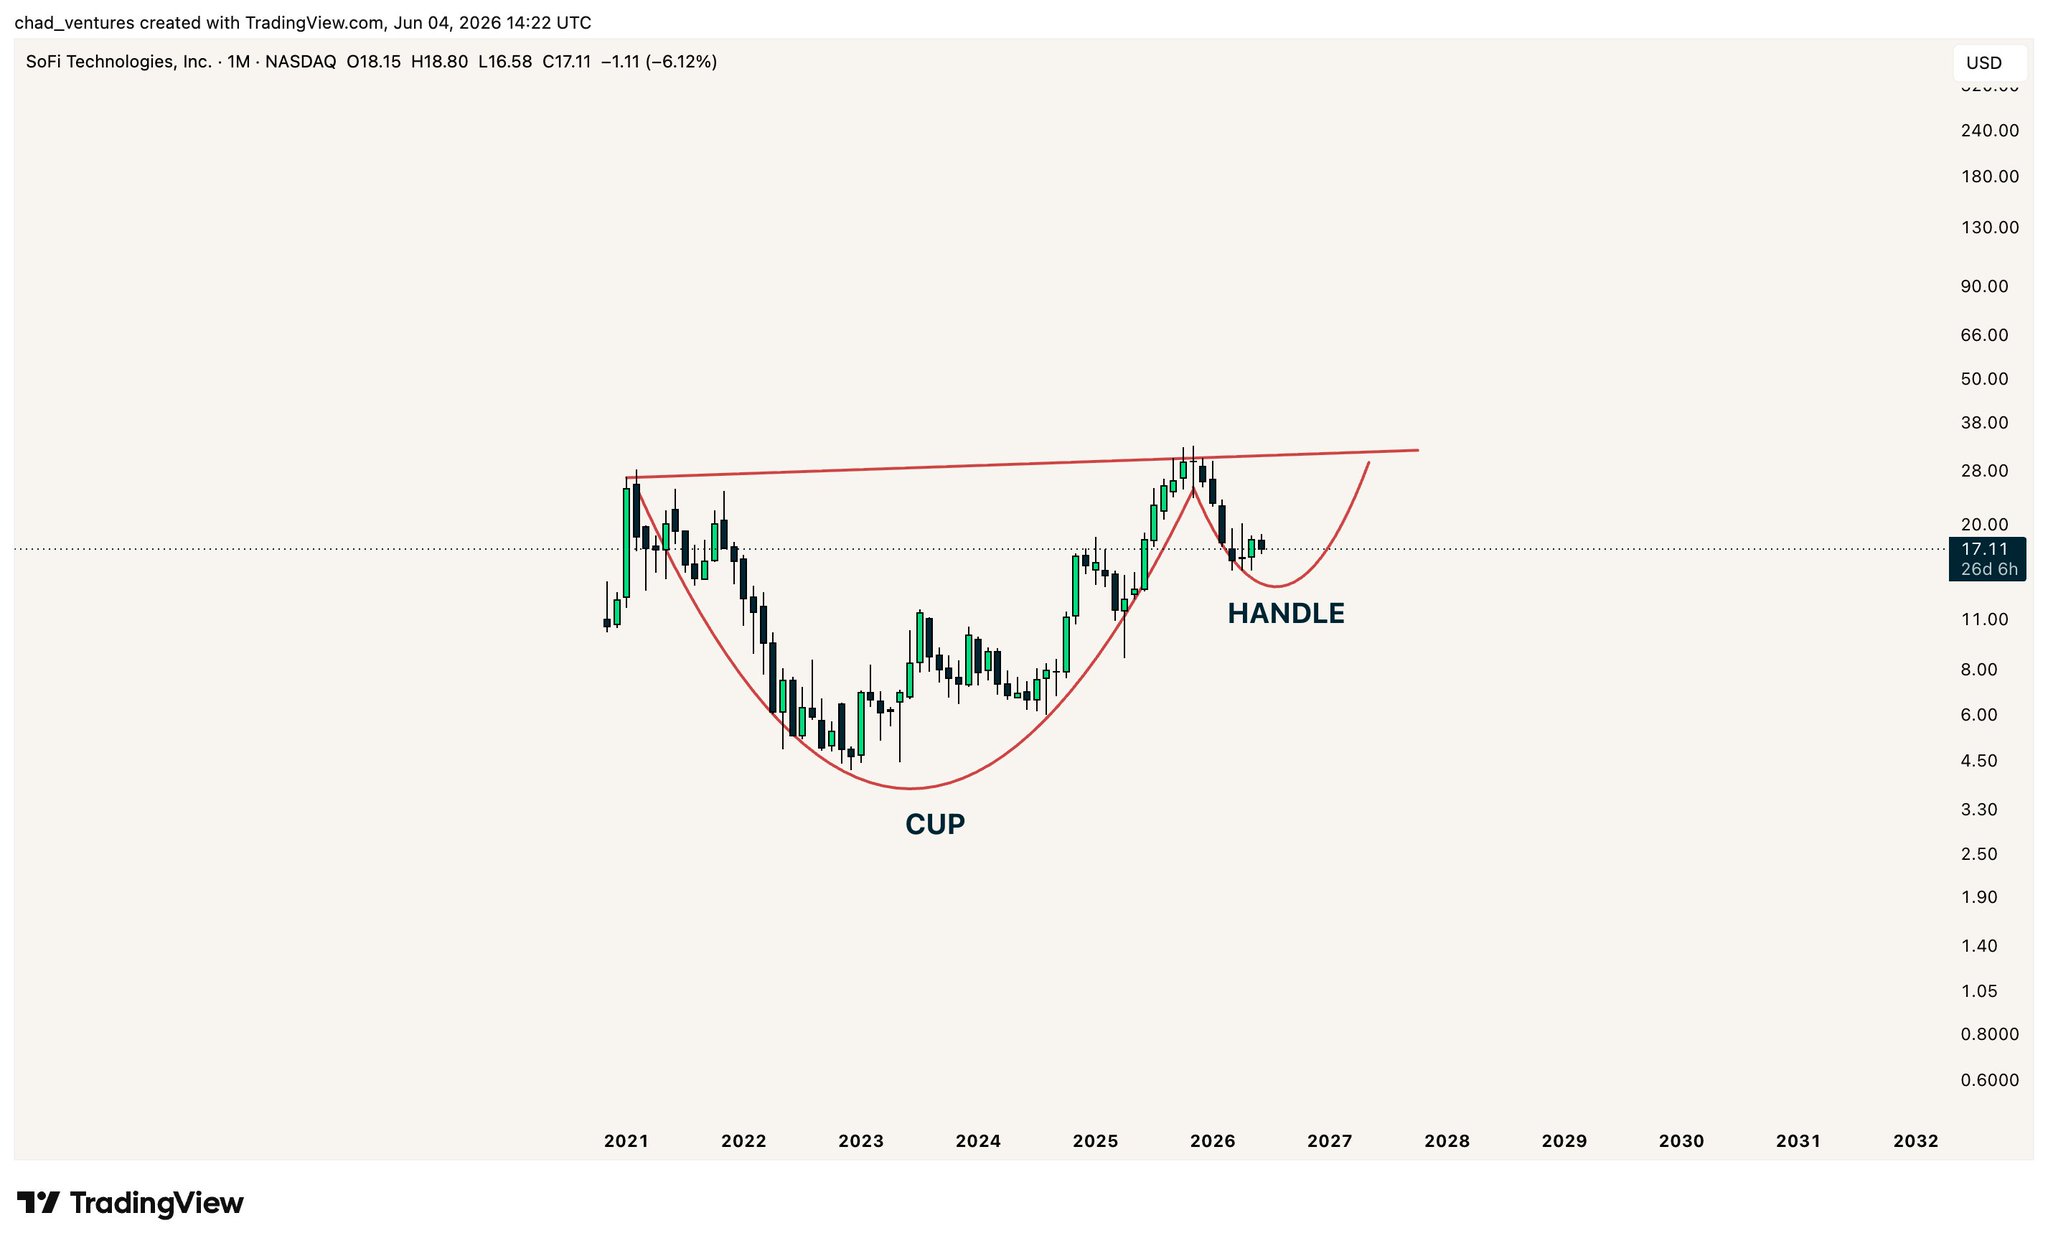
21.3K @chad_ventures $SOFI monthly cup & handle forming
Sentiment is always terrible near the bottom of the handle
All in all, still looks like a HTF higher low so bullish structure is intact, objectively https://t.co/3hq60r0NKU
 192
6
18.7K
192
6
18.7K
2026-06-04 20:37
リリース後のSOFIのトレンド
強気
SOFI monthly chart forms a bullish cup‑handle pattern, structure intact, short‑term sentiment is weak.
chad.
TA_Analyst
Trader
B
21.3K @chad_ventures 中立
SOFI faces strong resistance at $19; a breakthrough would complete the bottoming.
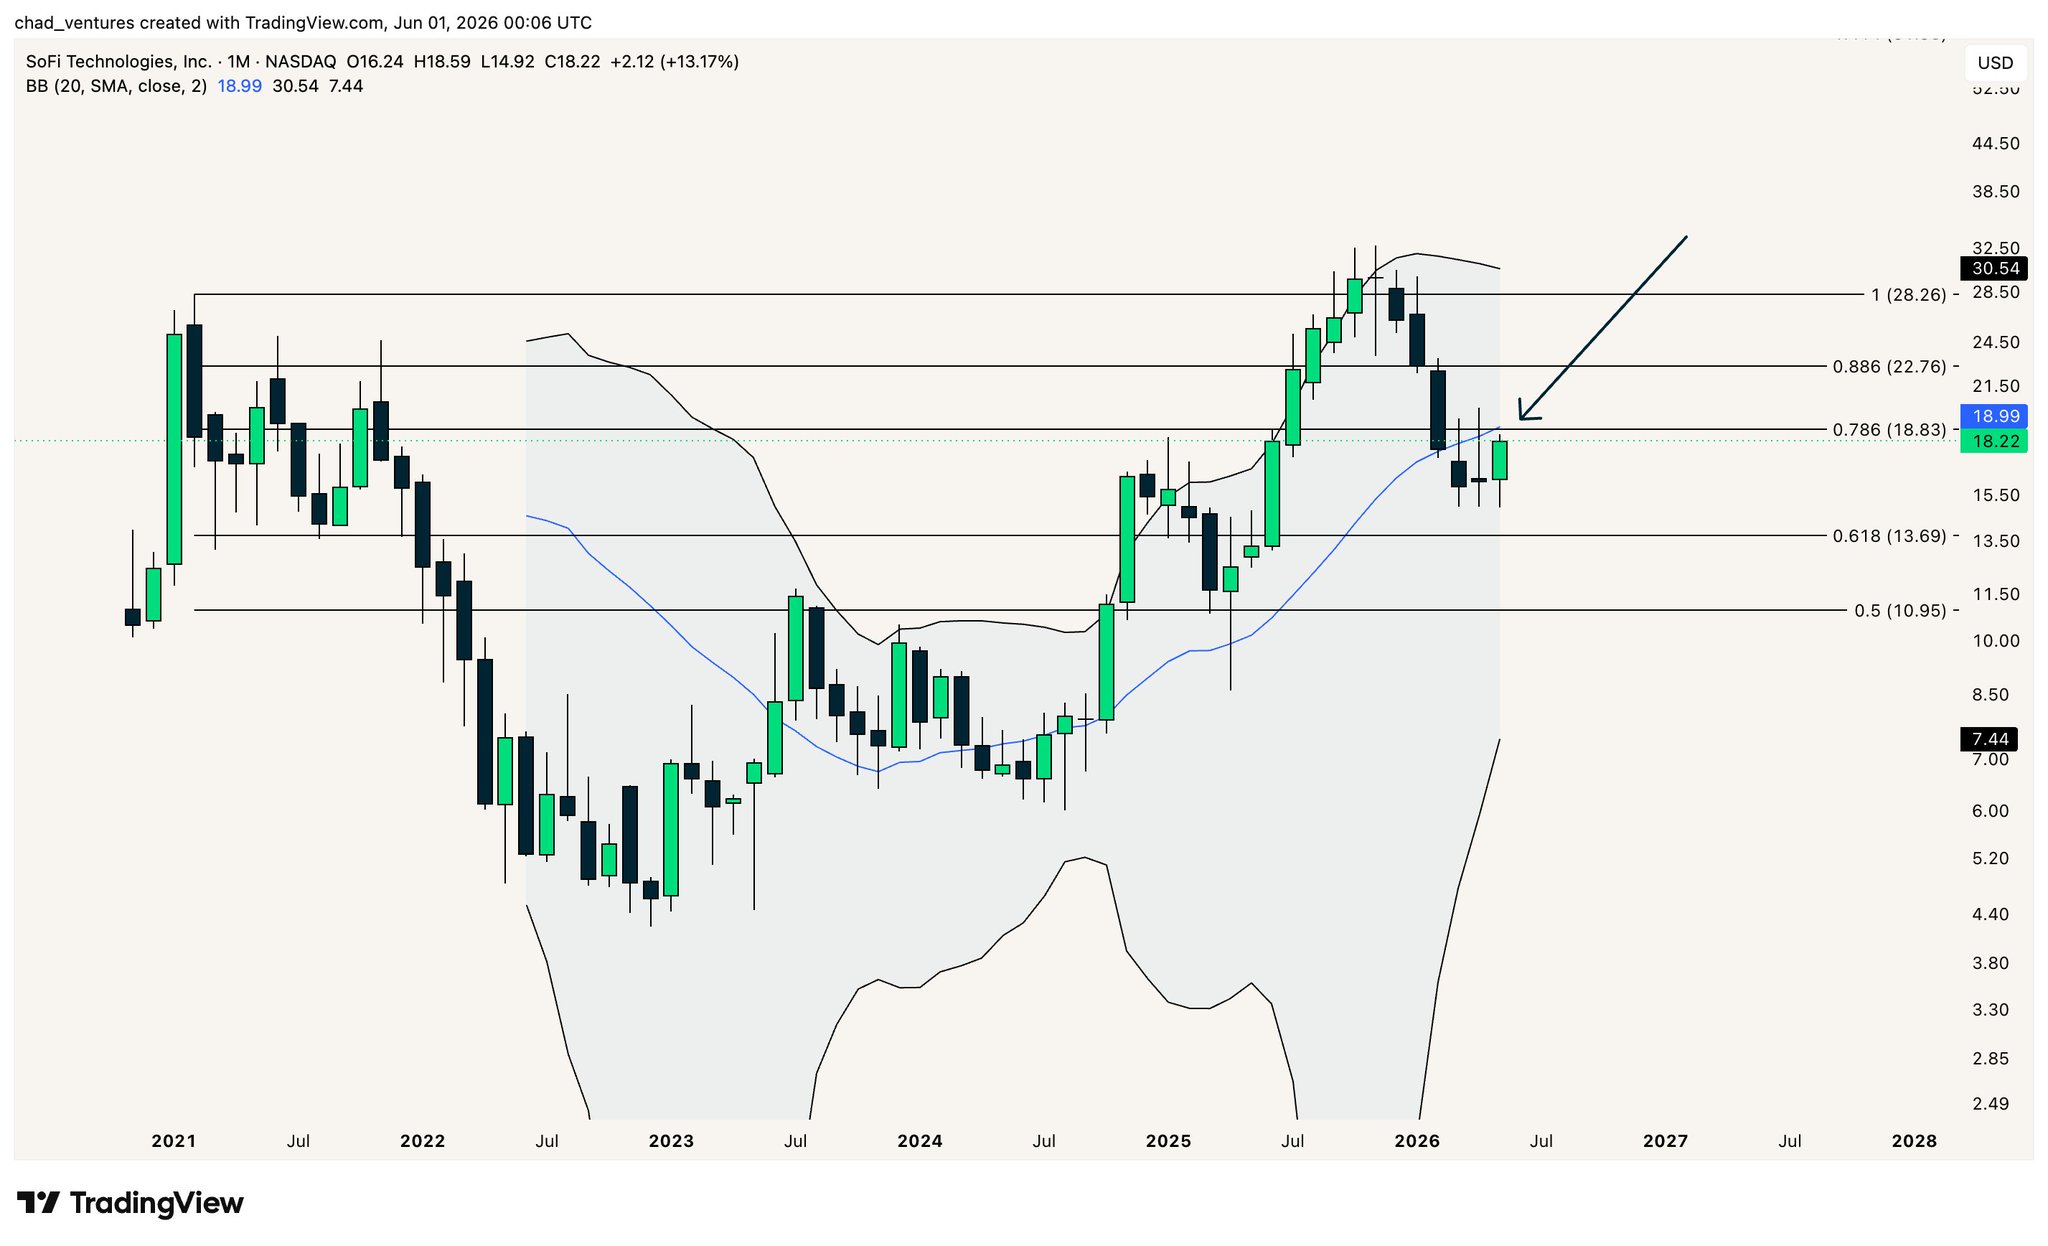
$SOFI is sitting at a strong resistance confluence from the 20-month SMA and 0.786 log Fibonacci level, both located around $19.
Essential to reclaim that area in order to confirm a higher low and wrap up the bottoming process. https://t.co/RoGiTJbjED
 42
3
3.6K
42
3
3.6K
2026-06-01 00:37
リリース後のSOFIのトレンド
中立
SOFI faces strong resistance at $19; a breakthrough would complete the bottoming.
価格予測
SOFIを購入するのに良い時期はいつですか?SOFIは今買いでしょうか、売りでしょうか?
RAI Finance(SOFI)を購入または売却する適切な時期を決定する際は、まずご自身の取引戦略とリスクプロファイルに合わせることが重要です。長期投資家と短期トレーダーは市場状況を異なる方法で解釈することが多いため、決定には個人的なアプローチを反映すべきです。 最新の SOFI 4時間テクニカル分析によると、現在の取引シグナルは ホールド です。 最新のSOFI1日テクニカル分析によると、現在のシグナルはホールドです。

ビーコン予測
の確率的価格予測(今後24時間)ビーコン予測に関する免責事項
このページに表示されるデータ結果は、選択した取引ペアの実際の取引データ(OHLCV)と対応するテクニカル指標に基づいて分析されています。
この予測は実験的な技術的成果であり、あくまで参考目的で提供しています。これは投資アドバイスをではありません。現実世界での予期せぬ出来事が市場行動に大きな影響を与える可能性があります。トレーダーは慎重に意思決定を行うべきです。
この予測は実験的な技術的成果であり、あくまで参考目的で提供しています。これは投資アドバイスをではありません。現実世界での予期せぬ出来事が市場行動に大きな影響を与える可能性があります。トレーダーは慎重に意思決定を行うべきです。
アプリバージョン RAI Finance
RAI Finance (SOFI) is a cryptocurrency and operates on the Ethereum platform. RAI Finance has a current supply of 1,000,000,000 with 598,306,249.79 in circulation. The last known price of RAI Finance is 0.00004697 USD and is up 5.79 over the last 24 hours. It is currently trading on 21 active market(s) with $0.00 traded over the last 24 hours. More information can be found at https://rai.finance/.
続きを読む
Chain explorer
さらに詳しく
BM Discovery


新規上場

ZTRA Zentra Privacy
-- 0.00%

ATEG ATEG.DV
-- 0.00%

GCOIN G COIN
-- 0.00%

ISK$ Iskander Coin
-- 0.00%

$BLAST SafeBLAST
-- 0.00%

SPYON SPDR S&P 500 Tokenized ETF (Ondo)
-- 0.00%

QQQON Invesco QQQ Tokenized ETF (Ondo)
-- 0.00%

MCDON McDonald's Tokenized Stock (Ondo)
-- 0.00%

MSTRON MicroStrategy Tokenized Stock (Ondo)
-- 0.00%

AVGOON Broadcom Tokenized Stock (Ondo)
-- 0.00%