Tutorial: Using a trend-following strategy to short falling cryptocurrencies.
TUTORIAL TRADING HARIAN CRYPTO JALUR FOLLOW THE TREND (BEARISH)
Kemarin saya nulis metode follow the trend versi bullish, kali ini kita bahas yang versi bearishnya ya!
Metode ini memanfaatkan prinsip follow the trend.
Prinsip saya:
1. Yang turun akan terus turun sampai muncul tanda reversal.
2. Di crypto, sistemnya adalah habis manis sepah dibuang. Jadi yang beberapa hari lalu naik ratusan persen, bisa jadi hari ini mulai turun dan besok udah minus 80% (coba lihat contoh LAB)
Makanya, kita manfaatkan kalau ada yang habis naik, lalu kelihatan sudah mau turun, kita ikutan naik perosotannya
Step 1: Screening Pasar.
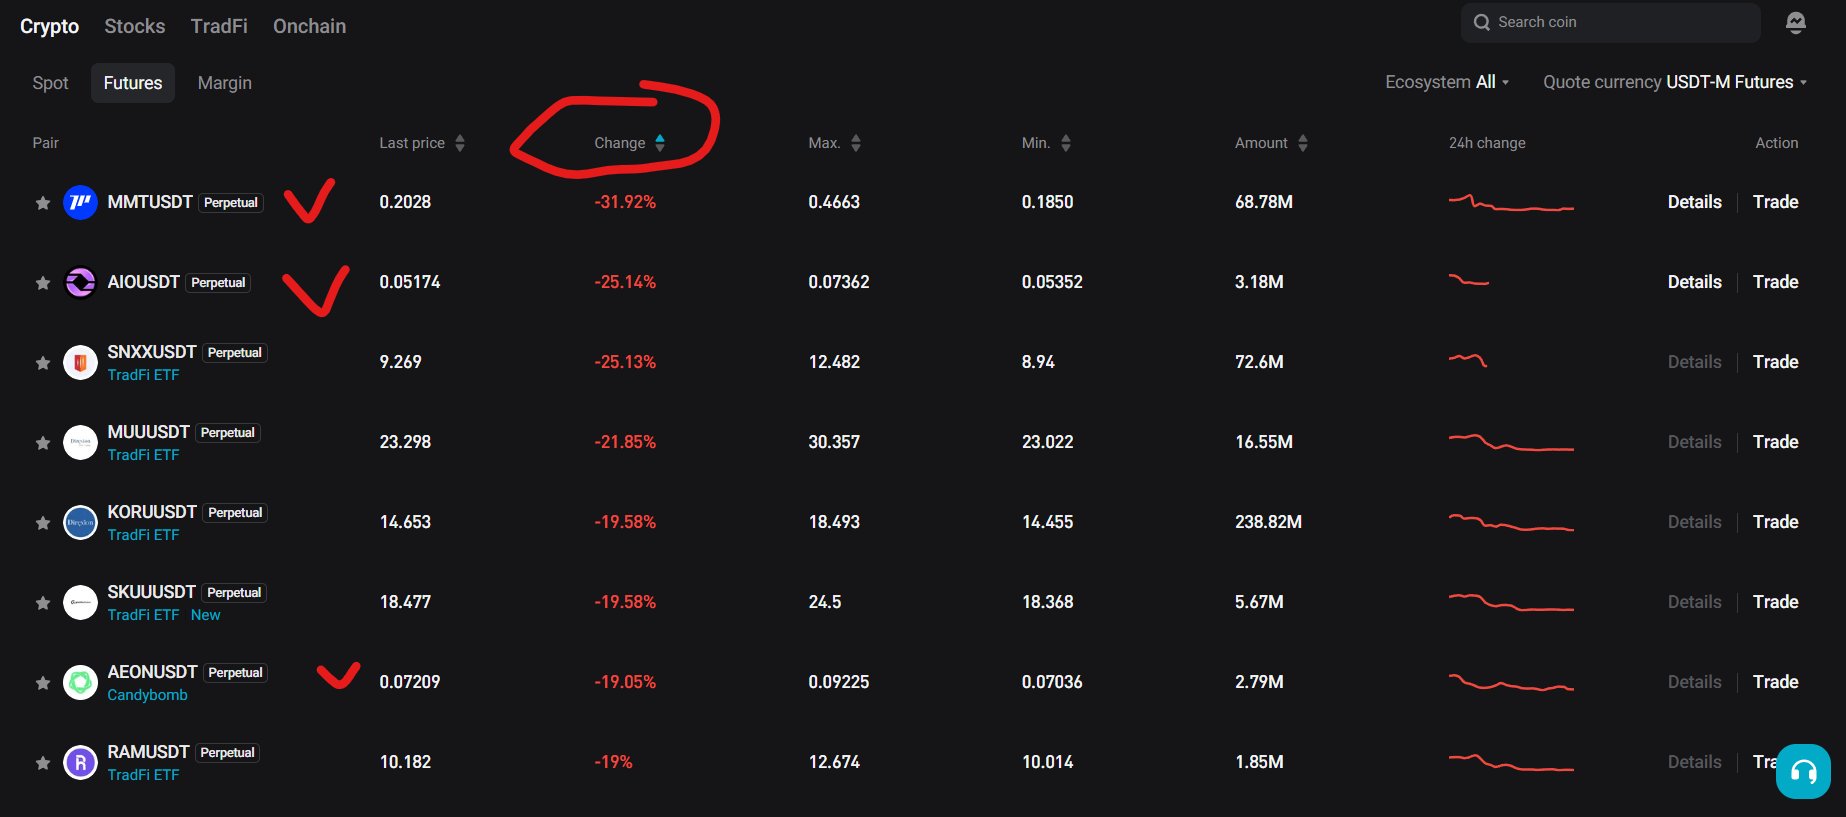
Pergi ke Coinmarketcap, atau ke exchange favoritmu. Sortir berdasarkan 24H% atau top losers. Pastikan kita dapet yang minusnya besar. Bisa dengan klik si 24H% atau %Gains tergantung exchangenya, sampai dia sortir dari yang paling rendah (lihat gambar 1). Contoh di gambar ada MMT, AIO, AEON, dan lain-lain. Skip dulu yang TradFi ya. Kita fokus crypto dulu
Step 2: Pastikan biasnya bearish
Buka tradingview (atau exchange yang kalian pakai, di chartnya). Ke timeframe 1 hari atau 4 jam dulu. Pastikan:
- Chartnya bearish (merah) dan
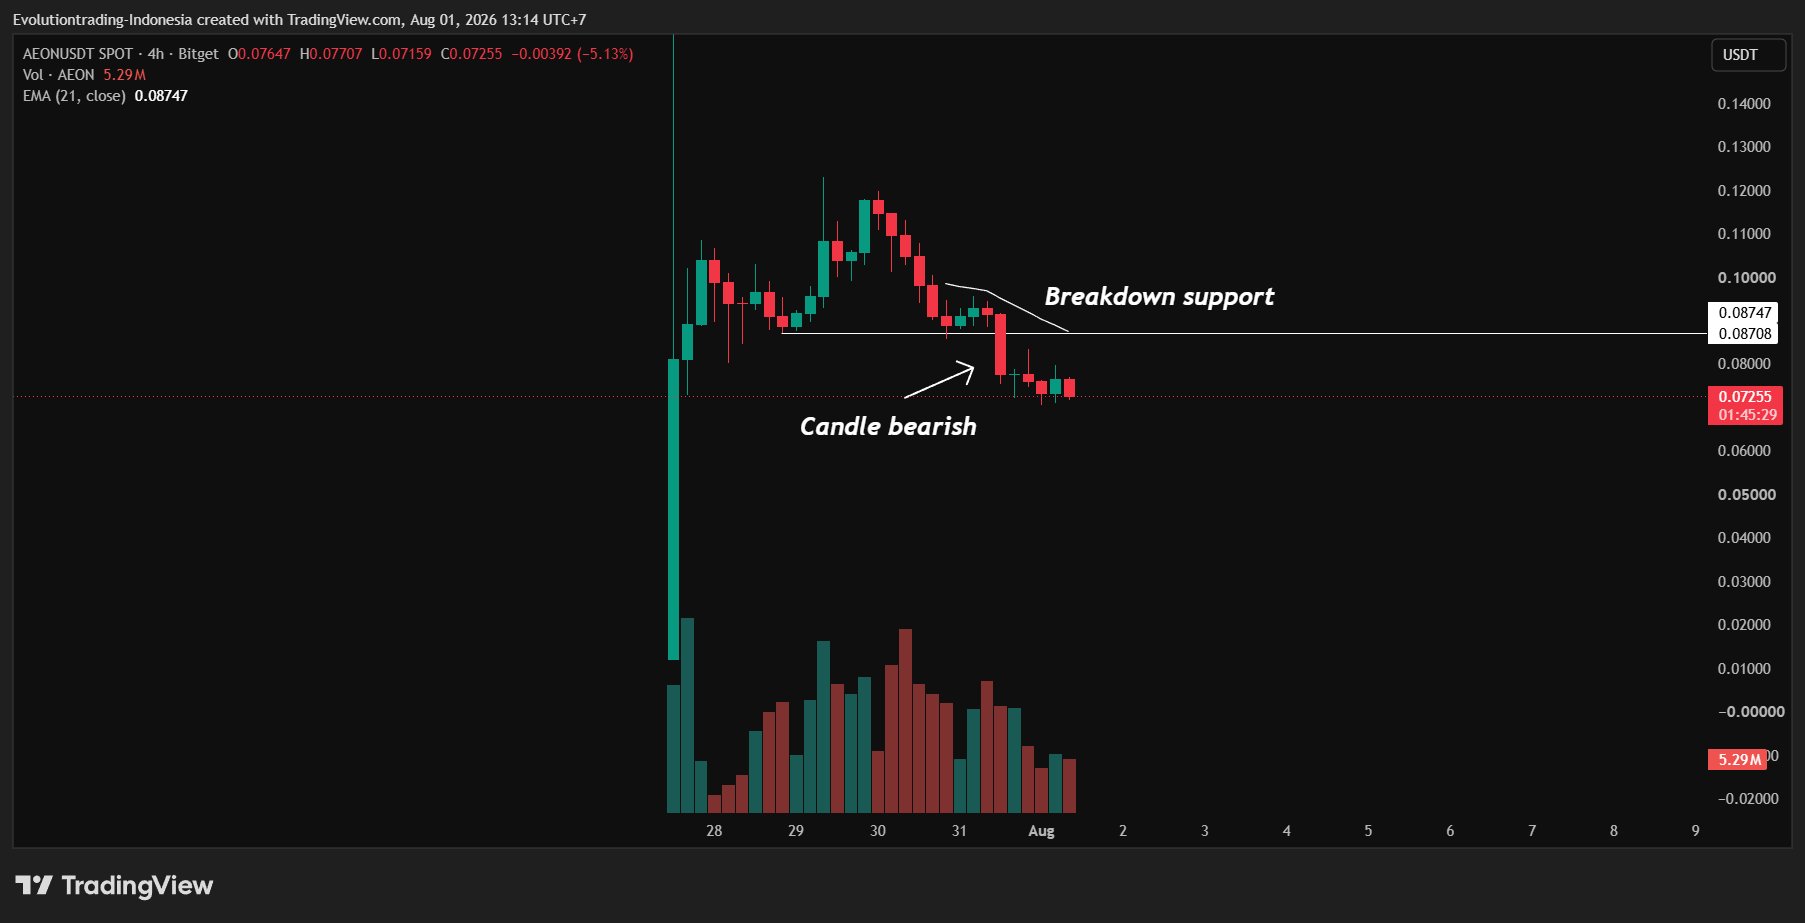
- Breakdown dari level penting dan/atau 21 EMA. Kalau untuk versi bearish, candle yang besar masih "oke" untuk ditradingkan. Asal bisa nahan loss atau sabar nunggu pullback dikit buat cari entry optimal
(Lihat contoh di gambar 2)
Ini bisa lihat beberapa chart. Tinggal tandai yang masuk kriteria, lalu ke step 3
Step 3: Entry Trigger
Khusus sekarang kita cari posisi short.
Ada banyak cara, nanti saya bahas di lain kesempatan.
Tapi kali ini, kita manfaatkan EMA 21 di timeframe 15 menit atau 1 jam sebagai resistance/support buat entry.
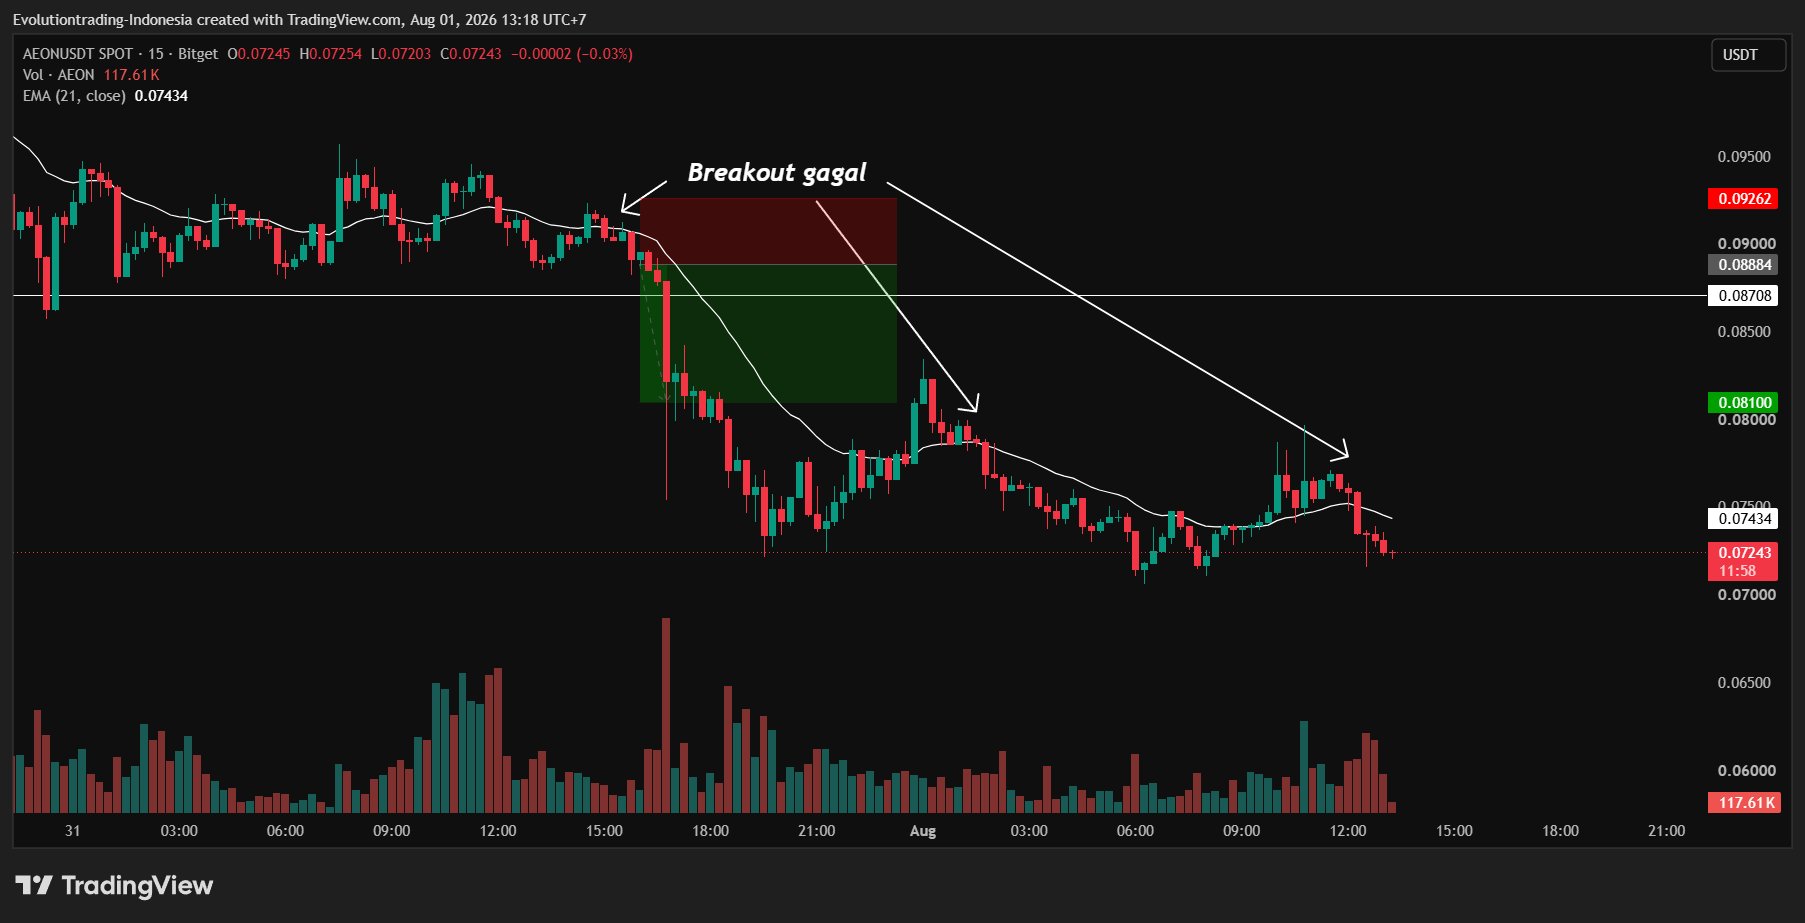
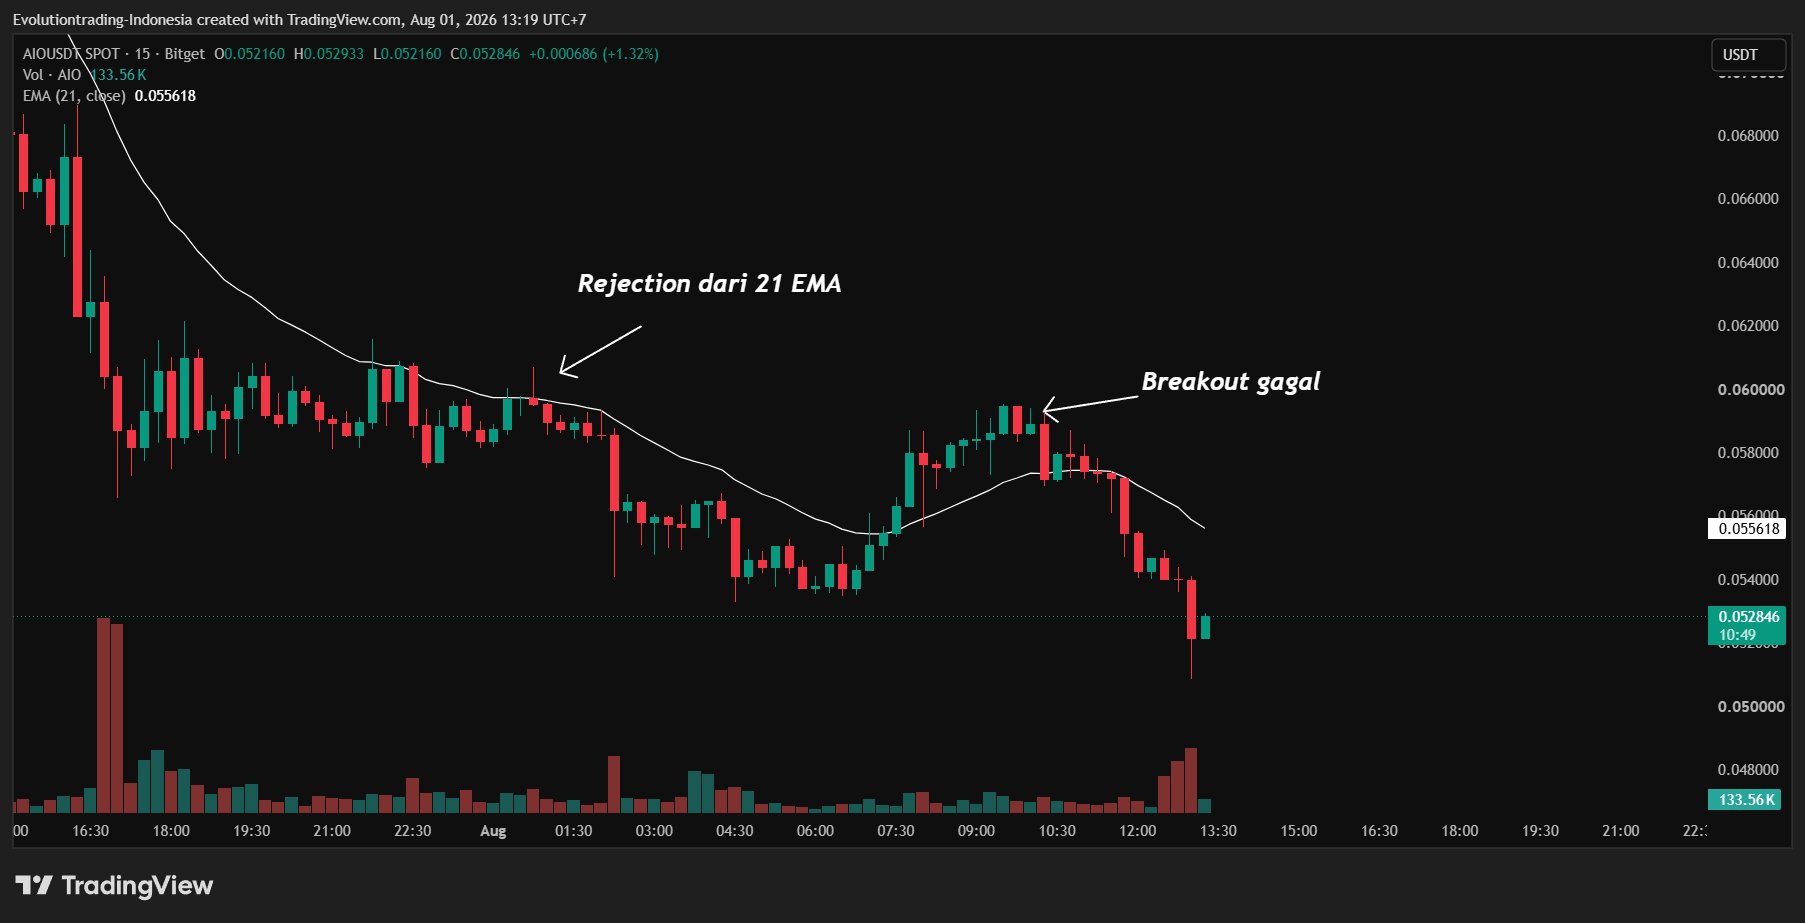
Kita cari/tunggu candle 15 menit membentuk pola yang syaratnya sbb:
- Merah solid bodynya besar dengan sedikit atau tidak ada wick ke bawah, jebol 21 EMA di timeframe 15 menit
- Bukan turun yang terlalu besar (tiang)
- Lebih utama kalau sebelumnya dia breakout EMA, lalu gagal dengan turun membentuk candle bearish
Perhatikan gambar 3 dan 4
Step 4: Stop Loss, Take Profit, dan Risk Management
Pasang stop loss di atas bagian candle yang keluar dari 21 EMA
Take profit: Bisa 2R dulu. Tapi kalau pengalaman saya, untuk penurunan crypto biasanya kenceng banget. Bisa sampai 4R bahkan 5R. Tapi jangan serakah ya. 2R menurut saya cukup. Sisanya bisa trailing
Karena ini day trading, dan kalian bisa buka banyak chart dan masuk beberapa aset sekaligus, sekali masuk 0.5% - 1% aja. Dan maksimal total masuk yang terekspos resiko 5% saja. Contoh: trade dengan risk 1% dan pegang 3 posisi trade, maka tersekpos 3%
Oke, silahkan di-backtest dulu aja. Atau di-front test dulu aja semingguan.
Beberapa batasan metode ini:
- Kadang kita gak tau si crypto-nya beneran udah crash, atau cuma koreksi. Kalau cuma koreksi di timeframe besar, bisa naik lagi lebih kenceng
- Biasanya yang lagi jadi top loser, pergerakannya volatile banget. Pemakaian leverage 5x aja bisa bikin liquidasi. Pastikan hitung dengan bener resikonya