口座開設
QRコードでアプリをダウンロードする
iOS & Android

Loomlay (LAY)

$
$ 0.00070 (LAY/USD)
65.12%
24H
24時間週足月足1年最大
How Do You Feel About LAY? today?
強気 0
弱気 0
強気
弱気
強気 0
弱気 0
Note: This information is for reference only.

Loomlay LAY Price History USD

Track the price of Loomlay for today, 7 days, 30 days and 90 days
期間
24H変動幅
24H変動率 (%)
本日
0
65.12%
7日
--
--
30日
--
--
90日
0
-79.25%

Own LAY Now

Buy and sell LAY easily and securely on BitMart.
Buy/Sell LAY Now
Buy/Sell {0} Now
Loomlay 相場情報
最終取引価格 $ 0.00070
$ 0.00042 24H変動幅 $ 0.00088
過去最高値
‎$ 0.029‎
過去最安値
‎$ 0.00022‎
24H変動幅
‎65.12%‎
24H取引高
‎$ 0‎
供給量
0.00 LAY
時価総額
‎$ 0‎
最大供給量
465.86M LAY
完全希薄化後時価総額
‎$ 330.60K‎
取引 LAY

稼ぐ

眠っている暗号資産を活用し、セービングやステーキングで安定収益を獲得。
今すぐ試す
今すぐ試す

Loomlay Xインサイト

avatar
Base chain AI microcap tokens generally experienced significant capital outflows and price drops in the past 24 hours, indicating market risk-off sentiment.

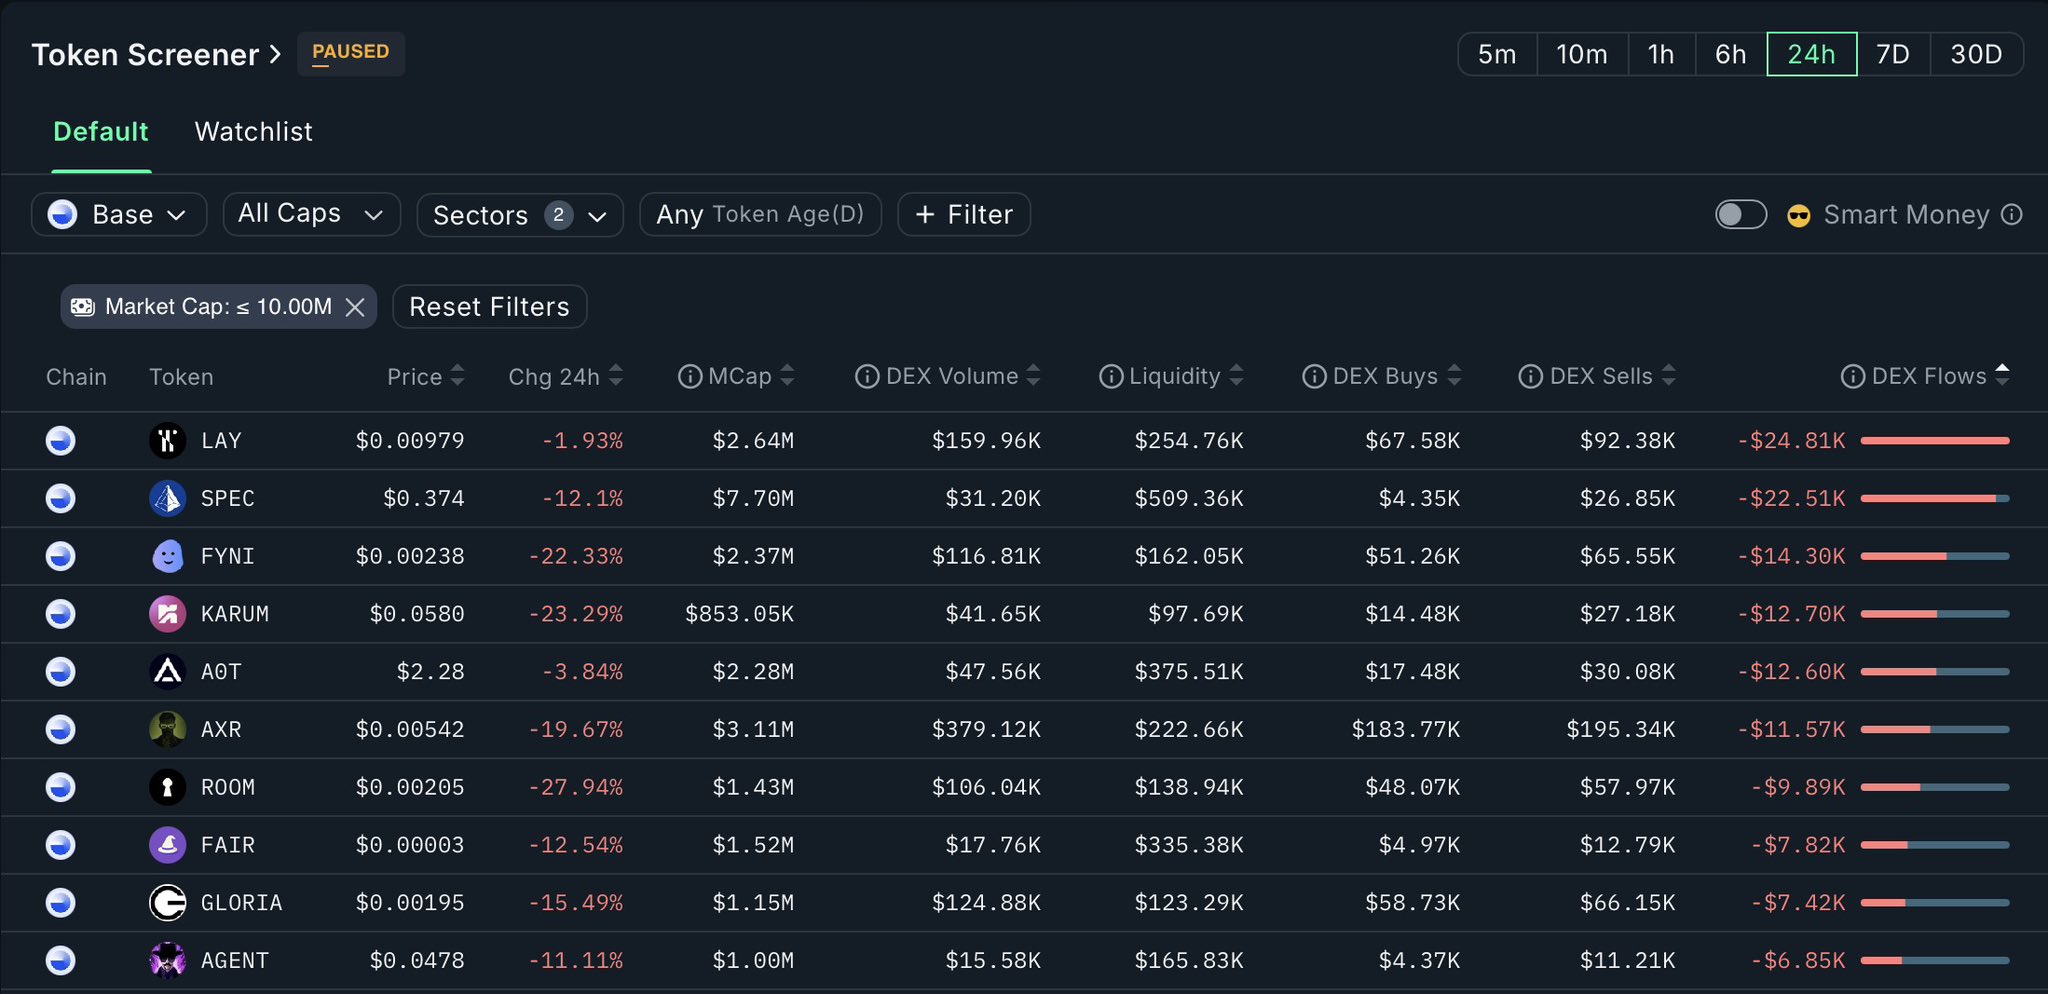
🚨📉 24h rundown of the 10 Base AI agent microcaps (<$10M) with the steepest net outflows via @nansen_ai:

📊 Price Change & Netflows
1️⃣ $LAY (-1.9%) — -$24.8K
2️⃣ $SPEC (-12.1%) — -$22.5K
3️⃣ $FYNI (-22.3%) — -$14.3K
4️⃣ $KARUM (-23.3%) — -$12.7K
5️⃣ $AOT (-3.8%) — -$12.6K
6️⃣ $AXR (-19.7%) — -$11.6K
7️⃣ $ROOM (-27.9%) — -$9.9K
8️⃣ $FAIR (-12.5%) — -$7.8K
9️⃣ $GLORIA (-15.5%) — -$7.4K
🔟 $AGENT (-11.1%) — -$6.9K

📌 Insight: ~$130K pulled from the 10 worst-hit AI agent microcaps — most down >10% on thin volume. $ROOM, $FYNI, and $KARUM led losses, with macro risk-off pressure clearly hitting sector long tail.

view 4
view 2
view 688
138 日 前
リリース後のLAYのトレンド
データなし
弱気
Base chain AI microcap tokens generally experienced significant capital outflows and price drops in the past 24 hours, indicating market risk-off sentiment.
avatar
Base chain AI microcap tokens experienced severe capital outflow and widespread price drops in the past 24 hours, indicating market fragility.

🚨📉 Top 10 @base AI microcaps (<$10M) by worst netflows via @nansen_ai (24h):

📊 Price Change & Netflows
1️⃣ $LAY (-1.9%) — -$24.8K
2️⃣ $SPEC (-12.1%) — -$22.5K
3️⃣ $FYNI (-22.3%) — -$14.3K
4️⃣ $KARUM (-23.3%) — -$12.7K
5️⃣ $AOT (-3.8%) — -$12.6K
6️⃣ $AXR (-19.7%) — -$11.6K
7️⃣ $ROOM (-27.9%) — -$9.9K
8️⃣ $FAIR (-12.5%) — -$7.8K
9️⃣ $GLORIA (-15.5%) — -$7.4K
🔟 $AGENT (-11.1%) — -$6.9K

📌 Insight: ~$130K drained from the top 10 worst-hit AI microcaps — most down >10% on thin volume. $ROOM, $FYNI, and $KARUM led the bleed, with macro pressure exposing fragility across the Base long tail.

view 0
view 0
view 218
138 日 前
リリース後のLAYのトレンド
データなし
非常に弱気
Base chain AI microcap tokens experienced severe capital outflow and widespread price drops in the past 24 hours, indicating market fragility.
詳細確認

価格予測

When is a good time to buy LAY? Should I buy or sell LAY now?

When deciding whether it’s a good time to buy or sell Loomlay (LAY), it’s important to first align with your own trading strategy and risk profile.Long-term investors and short-term traders often interpret market conditions differently, so your decision should reflect your personal approach. According to the latest LAY 4-hour technical analysis, the current trading signal is 売却. According to the latest LAY 1-day technical analysis, the current signal is 売却.
29
売却
4-hour technical analysis of LAY
Last Update 2026-02-08 04:41:24
32
売却
1-day technical analysis of LAY
Last Update 2026-02-08 04:41:24
beacon

ビーコン予測

Probabilistic Price Forecast (Next 24 Hours)
crypto.loading
アプリバージョン Loomlay
Loomlay (LAY) is a cryptocurrency launched in 2024and operates on the Base platform. Loomlay has a current supply of 465,813,837.22 with 0 in circulation. The last known price of Loomlay is 0.00029214 USD and is down -14.14 over the last 24 hours. It is currently trading on 17 active market(s) with $694.49 traded over the last 24 hours. More information can be found at https://loomlay.com/.
続きを読む