🔔The End of an Era: ICON Network Confirms Shutdown Plan and Final @sodaholders Migration Schedule
The crypto landscape is evolving, and so are its pioneers. ICON has officially announced the final timeline for its historic transition to SODAX:
the ICON Network will be permanently halted on December 31, 2026.
https://t.co/vOrofQUpvQ
Rewards
Futures Daily Draw
100% Chance To Win With Daily Trades
現物の日次のドロー
Win 8,888 USDT In Grand Prizes
ステークして投票
投票してエアドロップを獲得
機関
プロなかつ専門的なサービス対応
BitMart VIP
限定報酬のロック解除
アカデミー
トレードとブロックチェーンについて
BitMart Internship
Start your Crypto Career Here
BitMart Travel
ワンストップグローバルトラベルサービス
モバイルチャージ
モバイルを簡単に、オンラインで、安全にチャージ
Send
Send money globally, fast and secure
BitMartモール
Live on crypto

ICON (ICX)
$ 0.029 (ICX/USD)
0.00%
24H
ICON ライブ価格データ
ICONの今日の価格は$ 0.029 (ICX/USD)です。 時価総額$ 32.88M USD、 24時間取引量$ 857.69K USD、 24時間の価格変動+0.00%、 そして流通供給量1.10B ICX。
ICON ICX 価格履歴 USD
ICONの今日、7日間、30日間、90日間の価格を追跡
期間
24H変動幅
24H変動率 (%)
本日
$ 0
0.00%
7日
$ 0
0.00%
30日
$ 0.0099
-25.00%
90日
$ 0.0099
-25.00%
ICXを今すぐ所有
BitMartでICXを簡単に安全に売買できます。
ICON 相場情報
$ 0.029 24H変動幅 $ 0.029
過去最高値
$ 0.059
過去最安値
$ 0.029
24H変動幅
0.00%
24H取引高
$ 857,689.38
供給量
1.09B
ICX
時価総額
$ 32.88M
最大供給量
--
完全希薄化後時価総額
$ 33.23M
取引 ICX
ICON Xインサイト

Aalexxx™
Media
Researcher
C
 3.6K @Aaleks_crypt
 非常に弱気
ICON will shut down on December 31, 2026, and holders must migrate to SODA.
 2
2
 0
0
 28
28
2026-05-27 12:38
リリース後のICXのトレンド
弱気
ICON will shut down on December 31, 2026, and holders must migrate to SODA.

吴说区块链
Media
Educator
D
177.6K @wublockchain12 非常に弱気
ICX will shut down its network on December 31, 2026 and migrate to SODA, outlook bleak
South Korea's veteran public chain ICON announced that it will officially shut down its network on December 31, 2026, and complete the migration to SODAX. The official stated that the final migration deadline from ICX to SODA is also December 31, 2026, after which ICX will no longer be able to migrate. ICON said that as cross-chain and liquidity infrastructure mature, maintaining the Layer 1 no longer aligns with the project's direction. https://t.co/cqZvbnvoT2
2
2
2.9K
2026-05-25 14:56
リリース後のICXのトレンド
弱気
ICX will shut down its network on December 31, 2026 and migrate to SODA, outlook bleak

Crypto Patel
TA_Analyst
OnChain_Analyst
B
60.9K @CryptoPatel 弱気
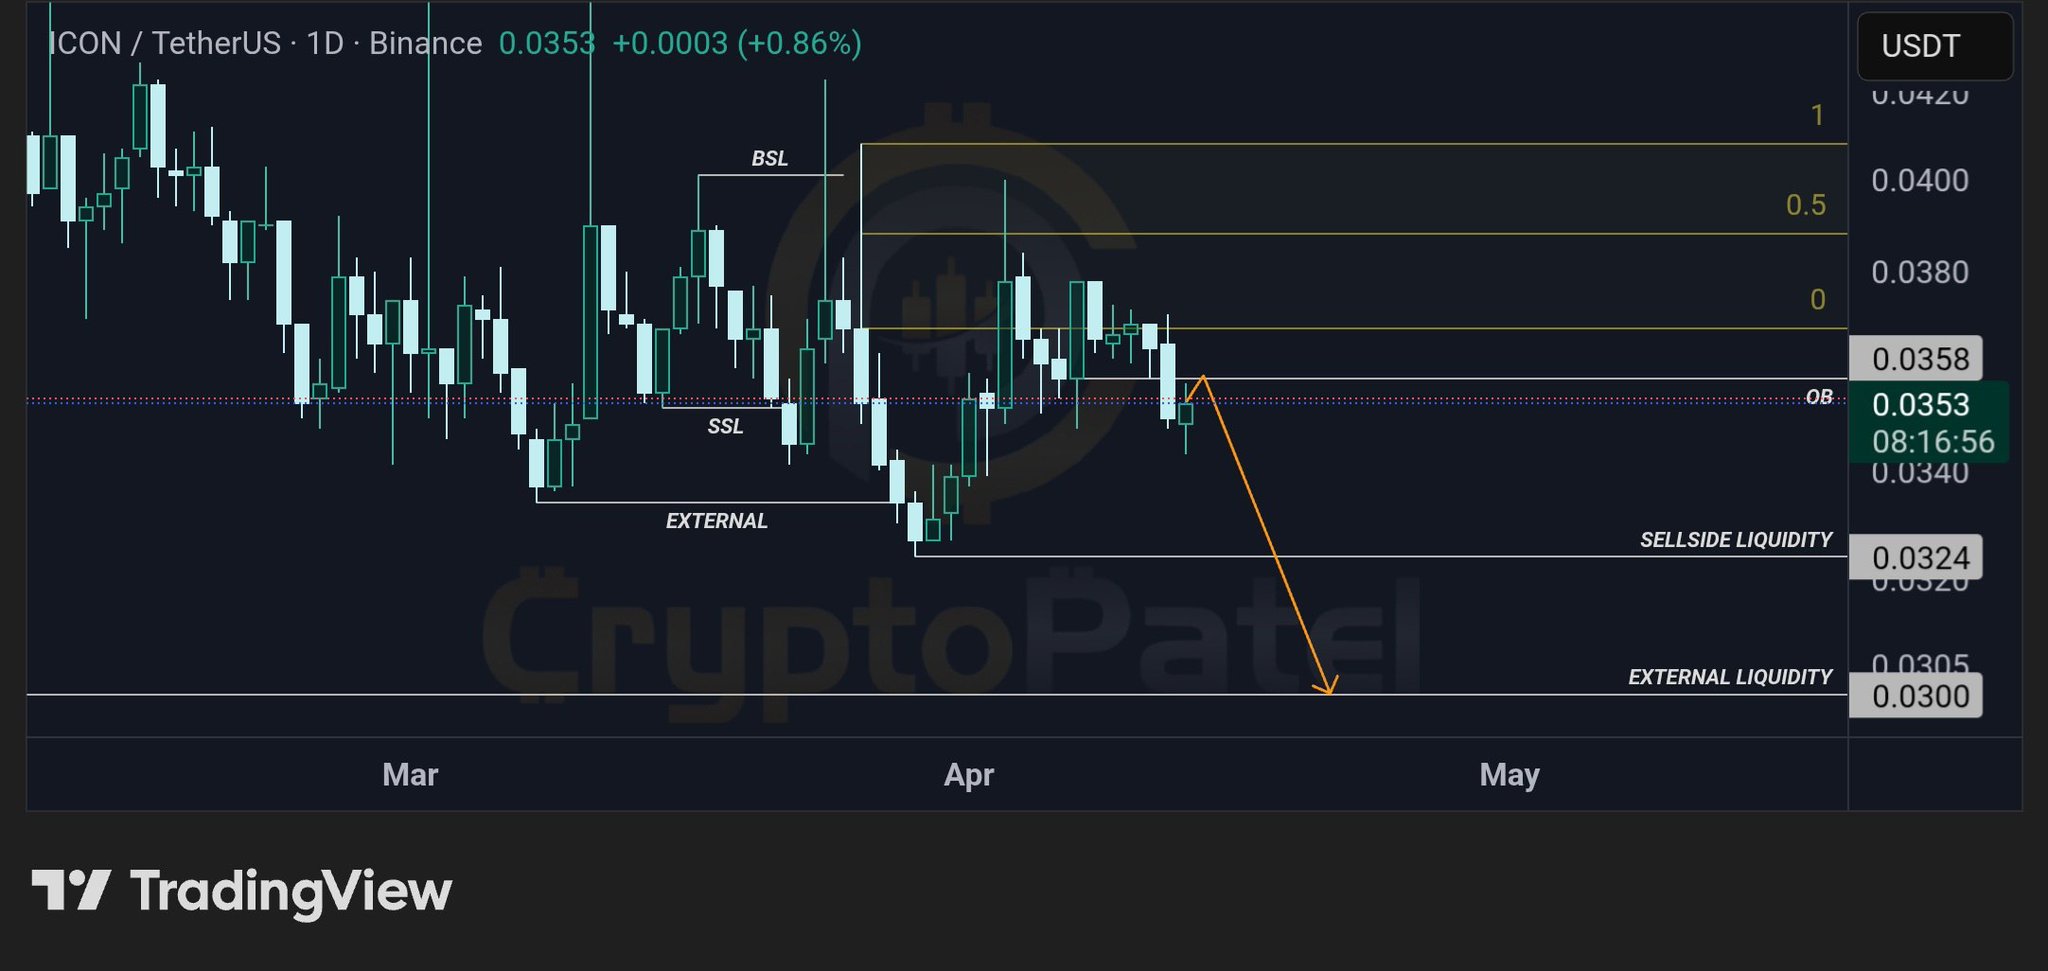
ICX technical outlook shows weakness, expected to continue falling to $0.0324‑$0.0300.
$ICX/USDT 1D SETUP | BEARISH CONTINUATION TOWARD SELL-SIDE LIQUIDITY
#ICX is reacting from a higher timeframe order block in a premium zone, showing weak bullish continuation and signs of distribution, favoring downside continuation toward liquidity below.
Technical Structure:
✅ Daily Order Block → strong resistance in premium zone
✅ Prior rejection → bearish intent confirmed
✅ Weak bullish continuation → distribution behavior
✅ HTF bearish structure forming
✅ Liquidity below → clear downside targets
Targets: $0.0324 → $0.0300
Invalidation: 1D close above $0.0387
Bearish bias. Wait for minor pullback / rejection inside OB and confirmation before entering toward sell-side liquidity.
TA Only. DYOR.
 230
11
5.7K
230
11
5.7K
2026-04-14 05:33
リリース後のICXのトレンド
非常に弱気
ICX technical outlook shows weakness, expected to continue falling to $0.0324‑$0.0300.
価格予測
ICXを購入するのに良い時期はいつですか?ICXは今買いでしょうか、売りでしょうか?
ICON(ICX)を購入または売却する適切な時期を決定する際は、まずご自身の取引戦略とリスクプロファイルに合わせることが重要です。長期投資家と短期トレーダーは市場状況を異なる方法で解釈することが多いため、決定には個人的なアプローチを反映すべきです。 最新の ICX 4時間テクニカル分析によると、現在の取引シグナルは ホールド です。 最新のICX1日テクニカル分析によると、現在のシグナルはホールドです。

ビーコン予測
の確率的価格予測(今後24時間)ビーコン予測に関する免責事項
このページに表示されるデータ結果は、選択した取引ペアの実際の取引データ(OHLCV)と対応するテクニカル指標に基づいて分析されています。
この予測は実験的な技術的成果であり、あくまで参考目的で提供しています。これは投資アドバイスをではありません。現実世界での予期せぬ出来事が市場行動に大きな影響を与える可能性があります。トレーダーは慎重に意思決定を行うべきです。
この予測は実験的な技術的成果であり、あくまで参考目的で提供しています。これは投資アドバイスをではありません。現実世界での予期せぬ出来事が市場行動に大きな影響を与える可能性があります。トレーダーは慎重に意思決定を行うべきです。
アプリバージョン ICON
ICON (ICX) is a cryptocurrency . ICON has a current supply of 1,108,792,174.2180953 with 1,097,115,985.7391582 in circulation. The last known price of ICON is 0.02879669 USD and is down -0.90 over the last 24 hours. It is currently trading on 168 active market(s) with $1,351,520.55 traded over the last 24 hours. More information can be found at https://icon.community.
続きを読む