
Don’t let Binance gobble too much of your supply
“The common denominator [for tokens trading below TGE/ICO price] is usually an airdrop to Binance Alpha and/or airdrop to participants who immediately dump at TGE”
Rewards
Futures Daily Draw
100% Chance To Win With Daily Trades
現物の日次のドロー
Win 8,888 USDT In Grand Prizes
ステークして投票
投票してエアドロップを獲得
機関
プロなかつ専門的なサービス対応
BitMart VIP
限定報酬のロック解除
アカデミー
トレードとブロックチェーンについて
BitMart Internship
Start your Crypto Career Here
BitMart Travel
ワンストップグローバルトラベルサービス
モバイルチャージ
モバイルを簡単に、オンラインで、安全にチャージ
Send
Send money globally, fast and secure
BitMartモール
Live on crypto

GraphAI (GAI)
$ 0.0029 (GAI/USD)
-2.62%
24H
GraphAI GAI 価格履歴 USD
GraphAIの今日、7日間、30日間、90日間の価格を追跡
期間
24H変動幅
24H変動率 (%)
本日
$ 0.000079
-2.62%
7日
$ 0.00033
12.55%
30日
$ 0.00056
-15.75%
90日
$ 0.0069
-69.50%
GAIを今すぐ所有
BitMartでGAIを簡単に安全に売買できます。
GraphAI 相場情報
$ 0.0029 24H変動幅 $ 0.0030
過去最高値
$ 0.85
過去最安値
$ 0.0022
24H変動幅
-2.62%
24H取引高
$ 879.23
供給量
0.00
GAI
時価総額
$ 0
最大供給量
100.00M
GAI
完全希薄化後時価総額
$ 296.73K
取引 GAI
GraphAI Xインサイト

Kevin Simback 🍷
VC
Tokenomics_Expert
S
 18.1K @KSimback
 非常に弱気
AI projects are being dumped due to Binance airdrops, trading below the issue price; caution is advised.
 14
14
 3
3
 1.6K
1.6K
2025-11-27 13:57
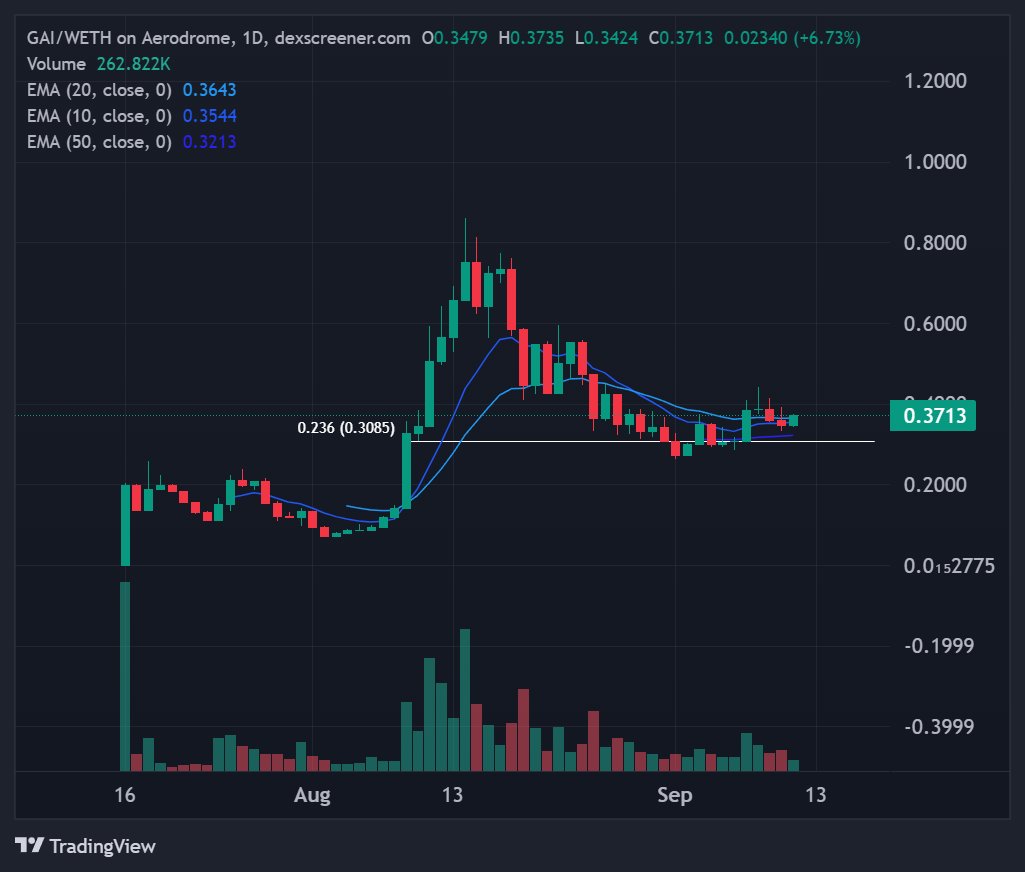
リリース後のGAIのトレンド
弱気
AI projects are being dumped due to Binance airdrops, trading below the issue price; caution is advised.

cevo
Influencer
Media
B
389.6K @cryptocevo 強気
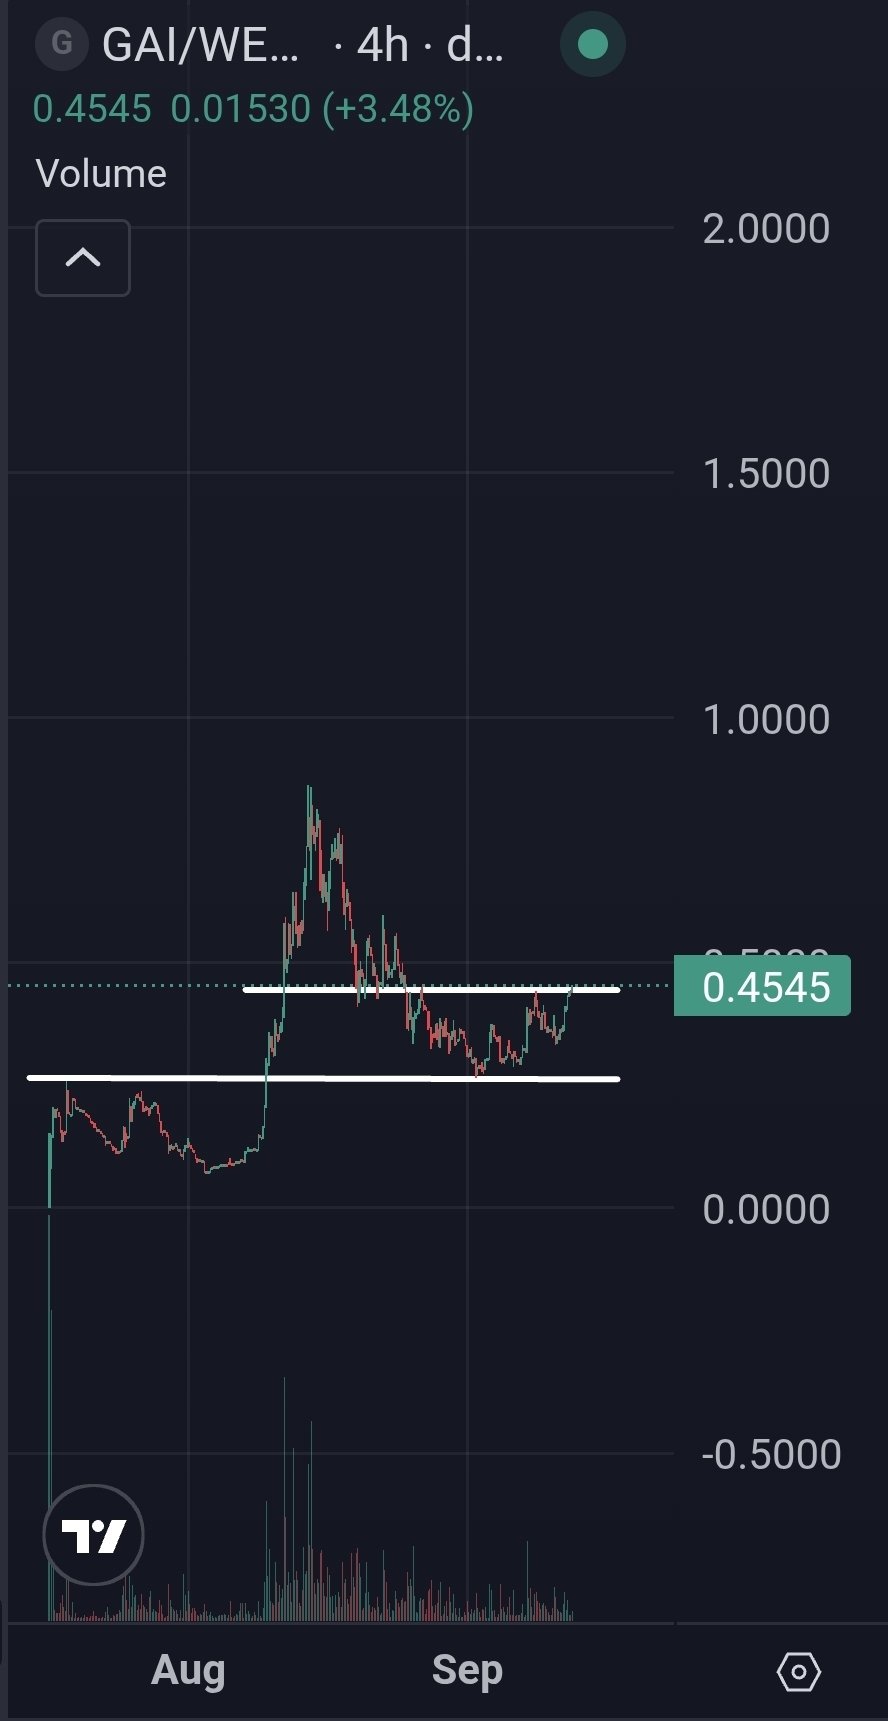
The tweet suggests that GAI coin is performing well, and the image shows its price near a key resistance level.

doc🃏 D
46.0K @jkrdoc $GAI looking good here. https://t.co/Bd0B7eEQHy
 83
25
15.3K
83
25
15.3K
2025-09-12 12:58
リリース後のGAIのトレンド
強気
The tweet suggests that GAI coin is performing well, and the image shows its price near a key resistance level.
cevo
Influencer
Media
B
389.6K @cryptocevo 非常に強気
The consolidation of GAI token after a strong initial run is nearing its end, with technical indicators showing stabilization and significant alliance integration benefits.

Avocado Toast
Trader
FA_Analyst
A
42.0K @avotoast $GAI consolidation after retracement from strong initial run nearing completion imo
Very transparent team that continues to publish updates each week
And now integrating into @ASI_Alliance with multi billion usd AI protocols https://t.co/nOtFLKDdNi https://t.co/xTbil5pVHO
 66
13
37.4K
66
13
37.4K
2025-09-11 18:58
リリース後のGAIのトレンド
非常に強気
The consolidation of GAI token after a strong initial run is nearing its end, with technical indicators showing stabilization and significant alliance integration benefits.
価格予測
GAIを購入するのに良い時期はいつですか?GAIは今買いでしょうか、売りでしょうか?
GraphAI(GAI)を購入または売却する適切な時期を決定する際は、まずご自身の取引戦略とリスクプロファイルに合わせることが重要です。長期投資家と短期トレーダーは市場状況を異なる方法で解釈することが多いため、決定には個人的なアプローチを反映すべきです。 最新の GAI 4時間テクニカル分析によると、現在の取引シグナルは 売却 です。 最新のGAI1日テクニカル分析によると、現在のシグナルは売却です。

ビーコン予測
の確率的価格予測(今後24時間)ビーコン予測に関する免責事項
このページに表示されるデータ結果は、選択した取引ペアの実際の取引データ(OHLCV)と対応するテクニカル指標に基づいて分析されています。
この予測は実験的な技術的成果であり、あくまで参考目的で提供しています。これは投資アドバイスをではありません。現実世界での予期せぬ出来事が市場行動に大きな影響を与える可能性があります。トレーダーは慎重に意思決定を行うべきです。
この予測は実験的な技術的成果であり、あくまで参考目的で提供しています。これは投資アドバイスをではありません。現実世界での予期せぬ出来事が市場行動に大きな影響を与える可能性があります。トレーダーは慎重に意思決定を行うべきです。
アプリバージョン GraphAI
GraphAI (GAI) is a cryptocurrency launched in 2025and operates on the Base platform. GraphAI has a current supply of 100,000,000 with 0 in circulation. The last known price of GraphAI is 0.00286475 USD and is up 7.49 over the last 24 hours. It is currently trading on 27 active market(s) with $0.00 traded over the last 24 hours. More information can be found at https://www.graphai.tech/.
続きを読む
さらに詳しく
BM Discovery


新規上場

ZTRA Zentra Privacy
-- 0.00%

GCOIN G COIN
-- 0.00%

ISK$ Iskander Coin
-- 0.00%

$BLAST SafeBLAST
-- 0.00%

SPYON SPDR S&P 500 Tokenized ETF (Ondo)
-- 0.00%

QQQON Invesco QQQ Tokenized ETF (Ondo)
-- 0.00%

MCDON McDonald's Tokenized Stock (Ondo)
-- 0.00%

MSTRON MicroStrategy Tokenized Stock (Ondo)
-- 0.00%

AVGOON Broadcom Tokenized Stock (Ondo)
-- 0.00%

CRCLON Circle Internet Group Tokenized Stock (Ondo)
-- 0.00%