$GEV holders, listen up, 🚨
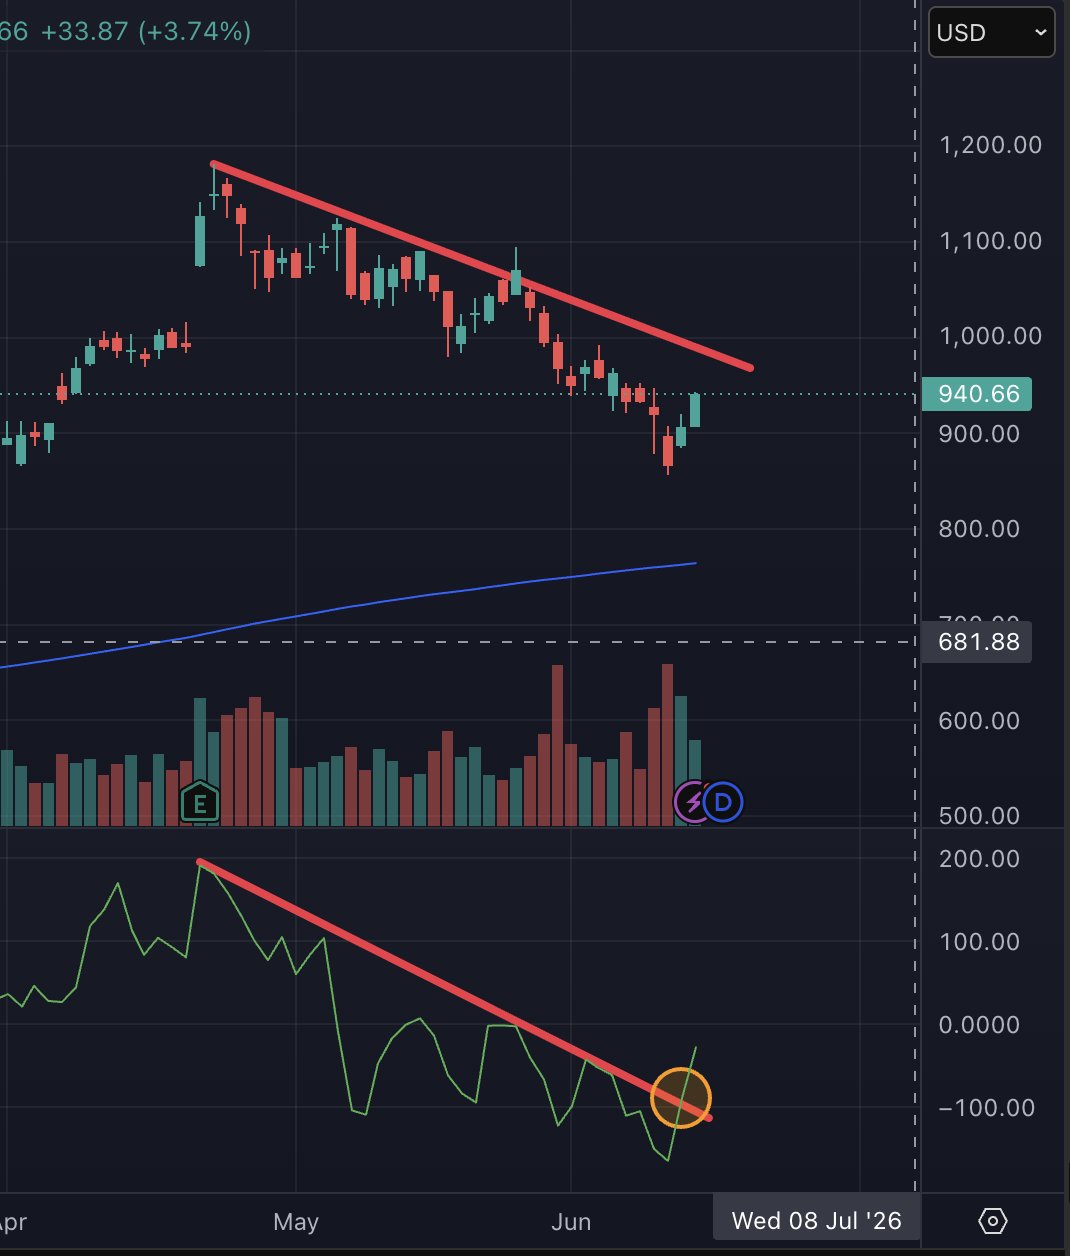
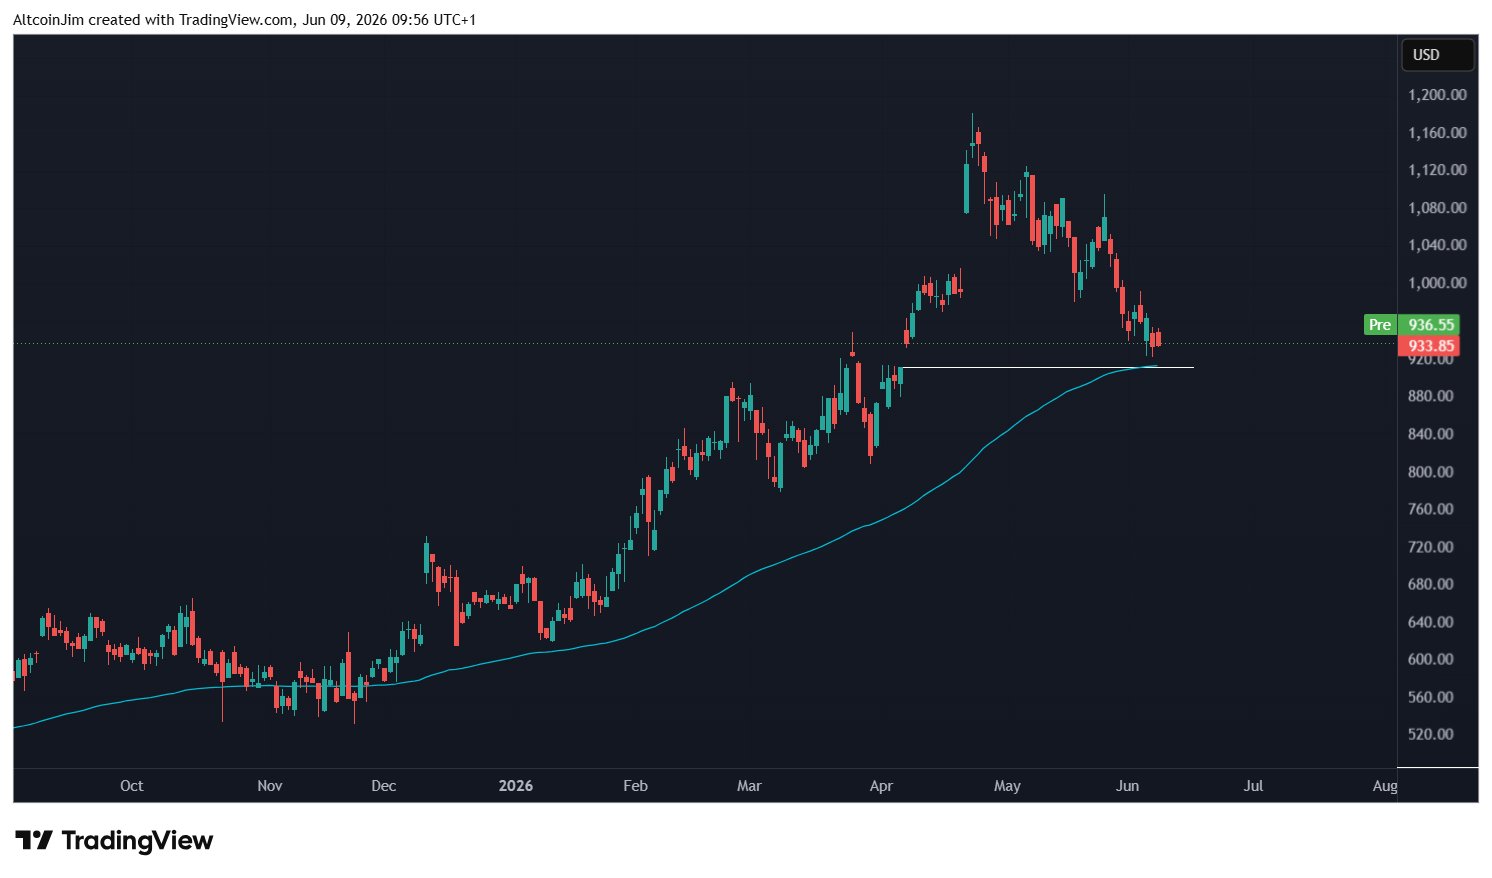
We just saw a perfect backtest of the breakout point for GEV.
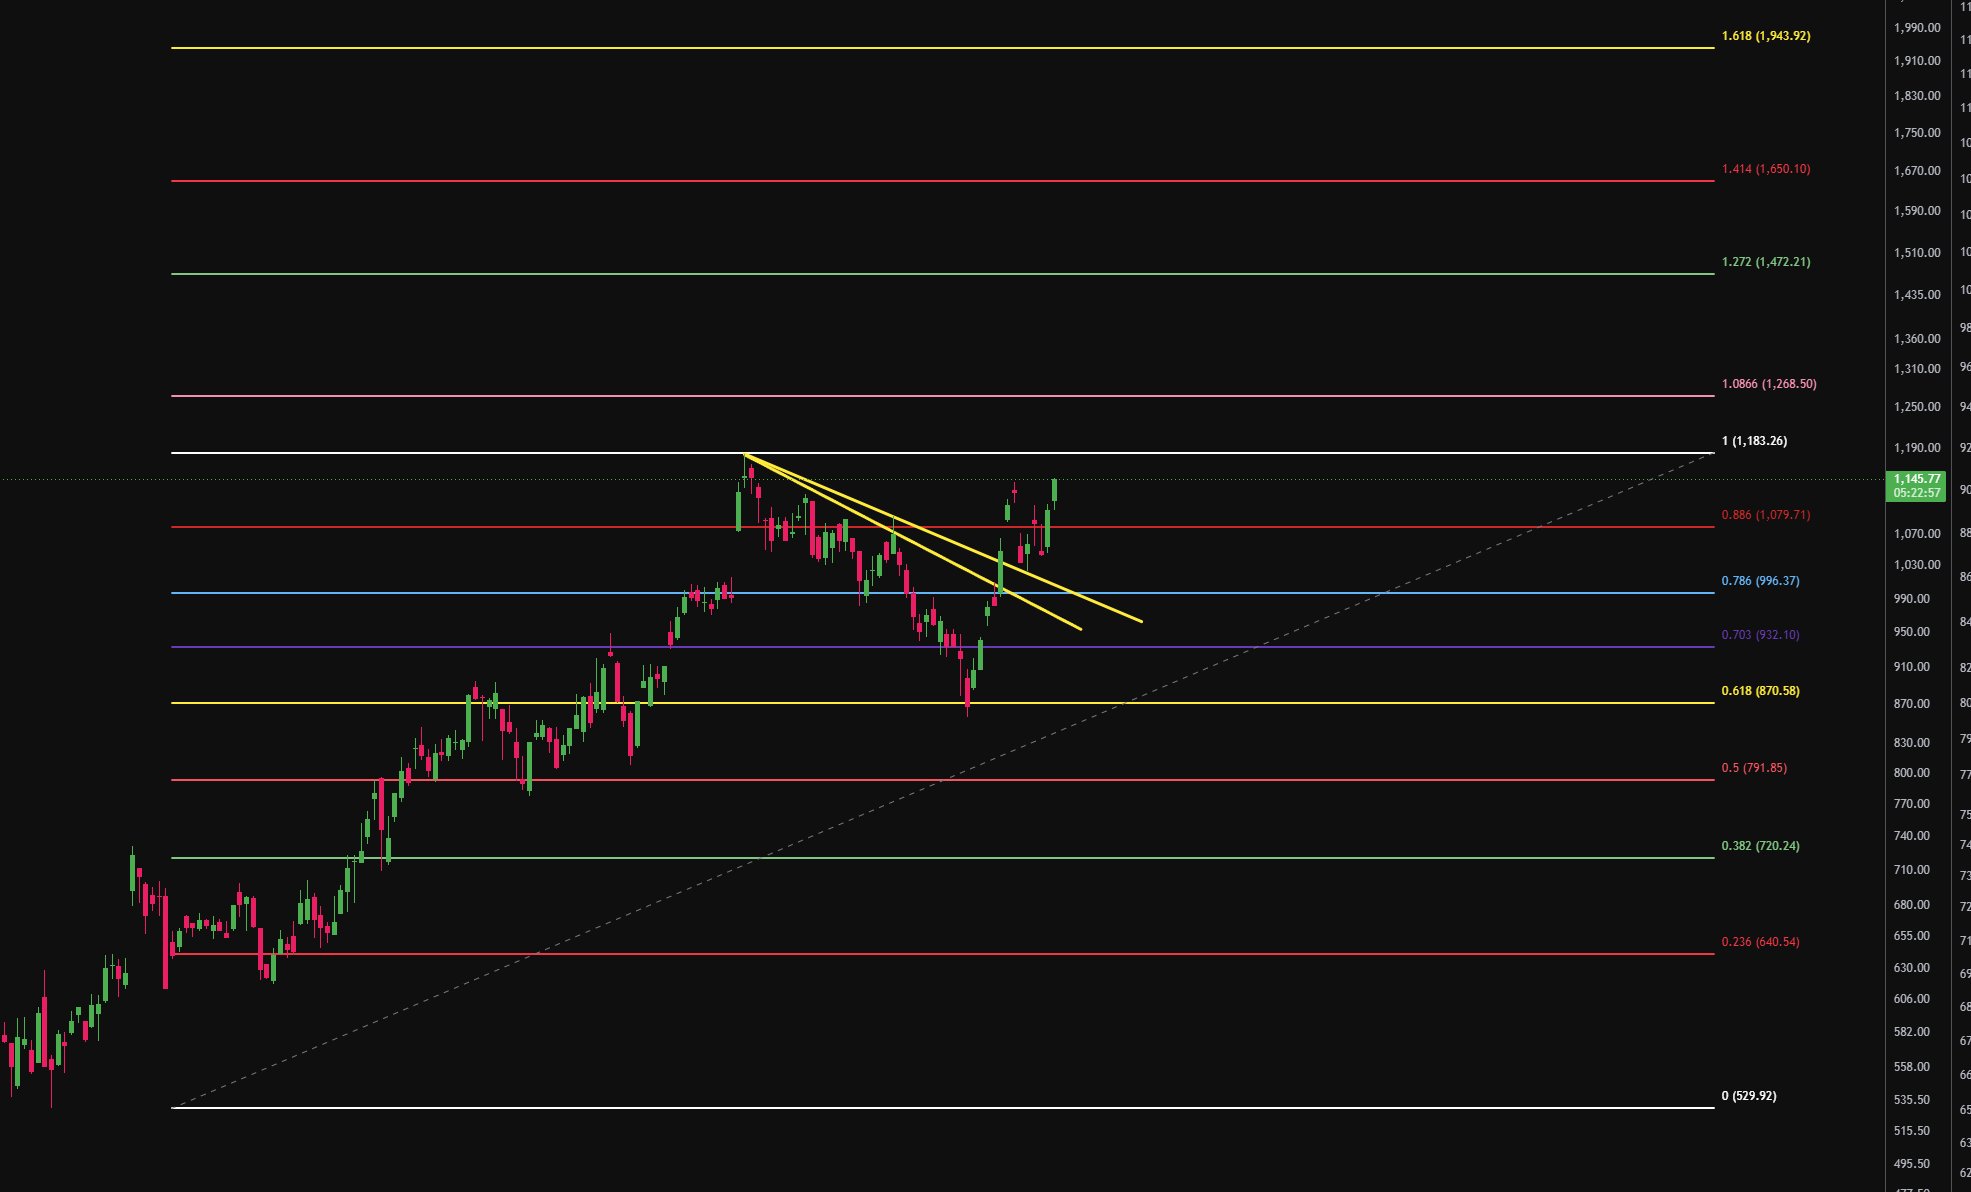
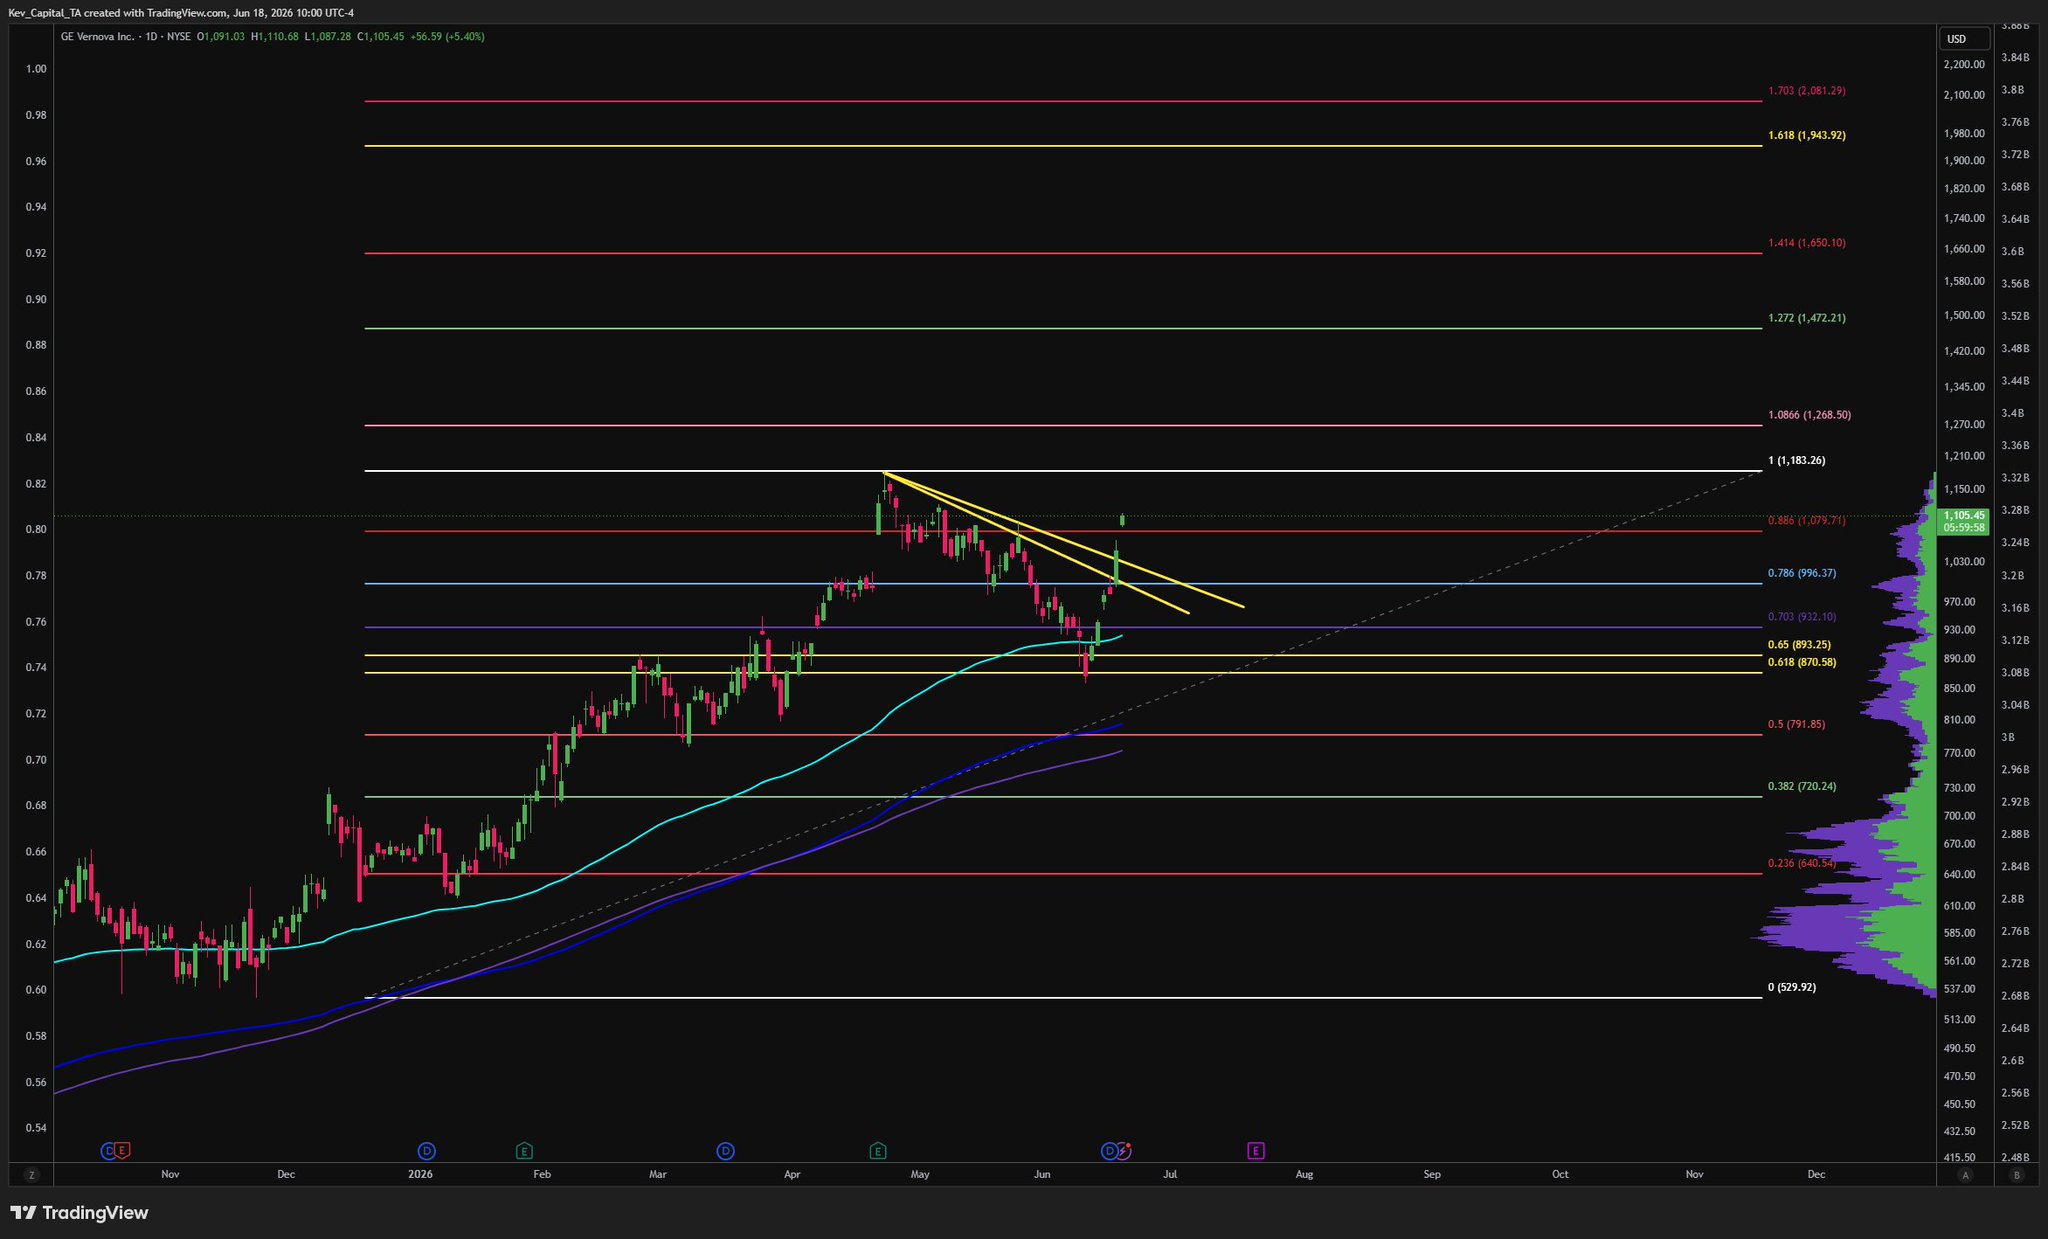
Myself and many others in our group are still long from the golden pocket and added more positions during this backtest.
A new all-time high could be coming soon. 🚀 https://t.co/QCFKXjOedQ