

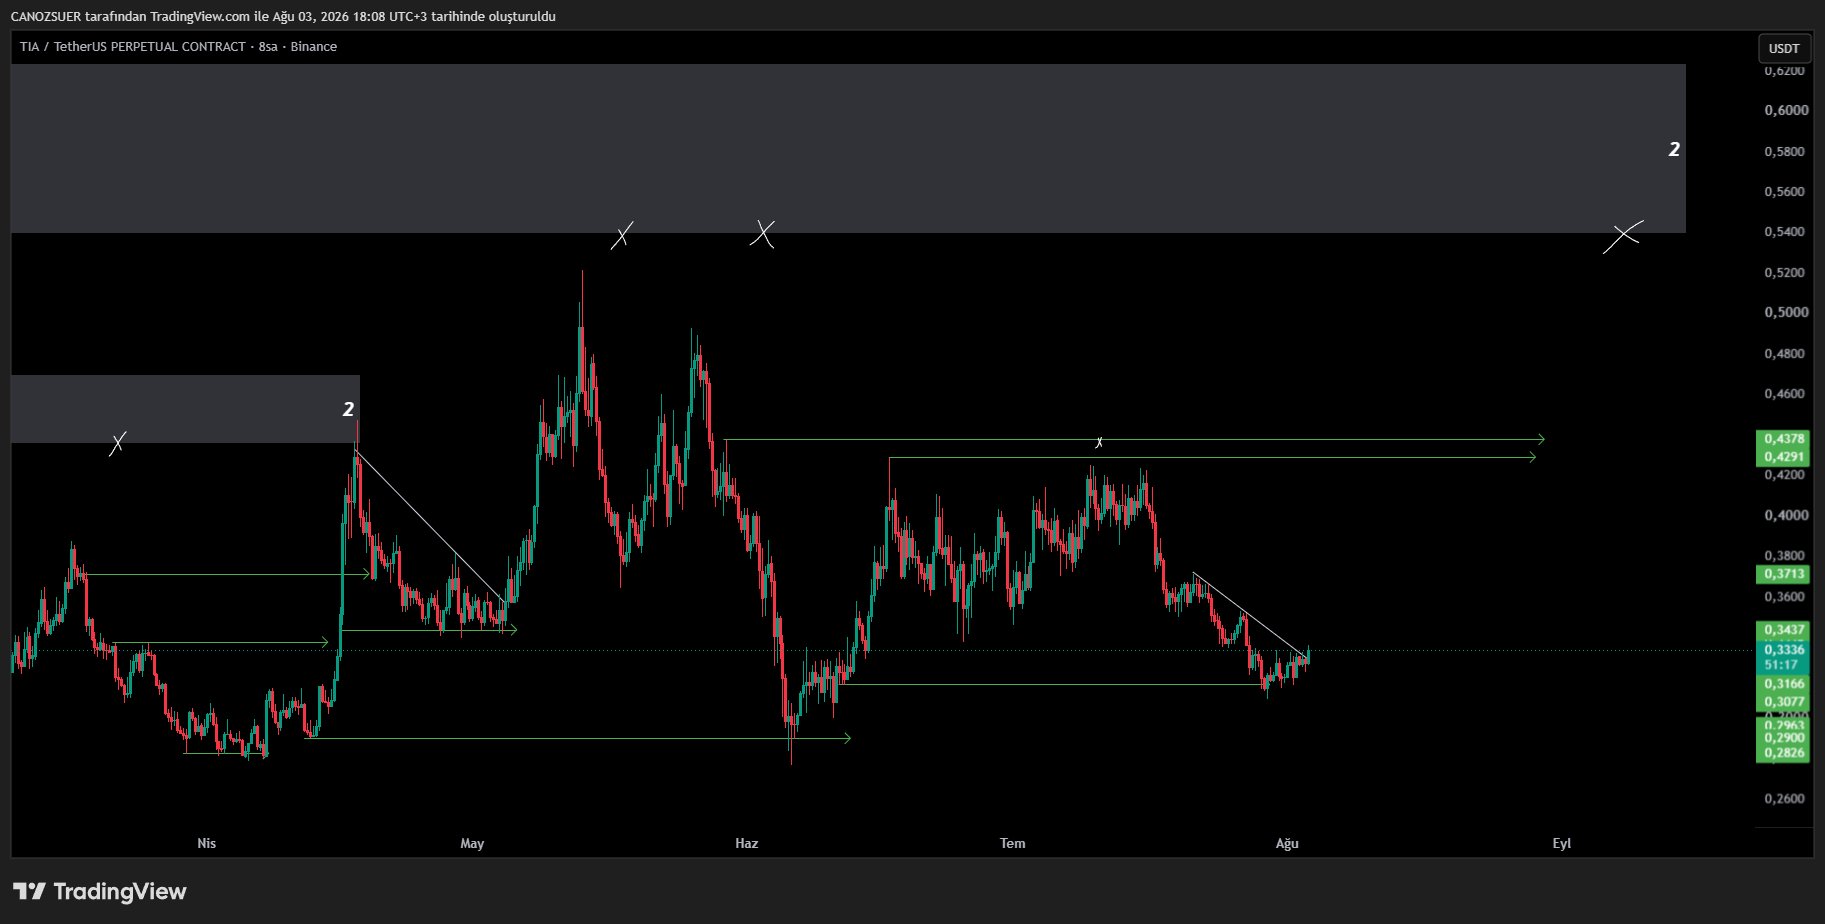
$TIA #TIAUSDT https://t.co/KvSj6xhC86


 99.1K @canozsuer
 $TIA #TIAUSDT https://t.co/KvSj6xhC86
 20
20
 3
3
 2.8K
2.8K
 1.2K @TakePr0fitN0w
 $TIA is sitting exactly where the biggest moves are usually born.
Most traders only notice $TIA after it starts running.
The real opportunity is when nobody wants to touch it.
And that’s exactly where we are now.
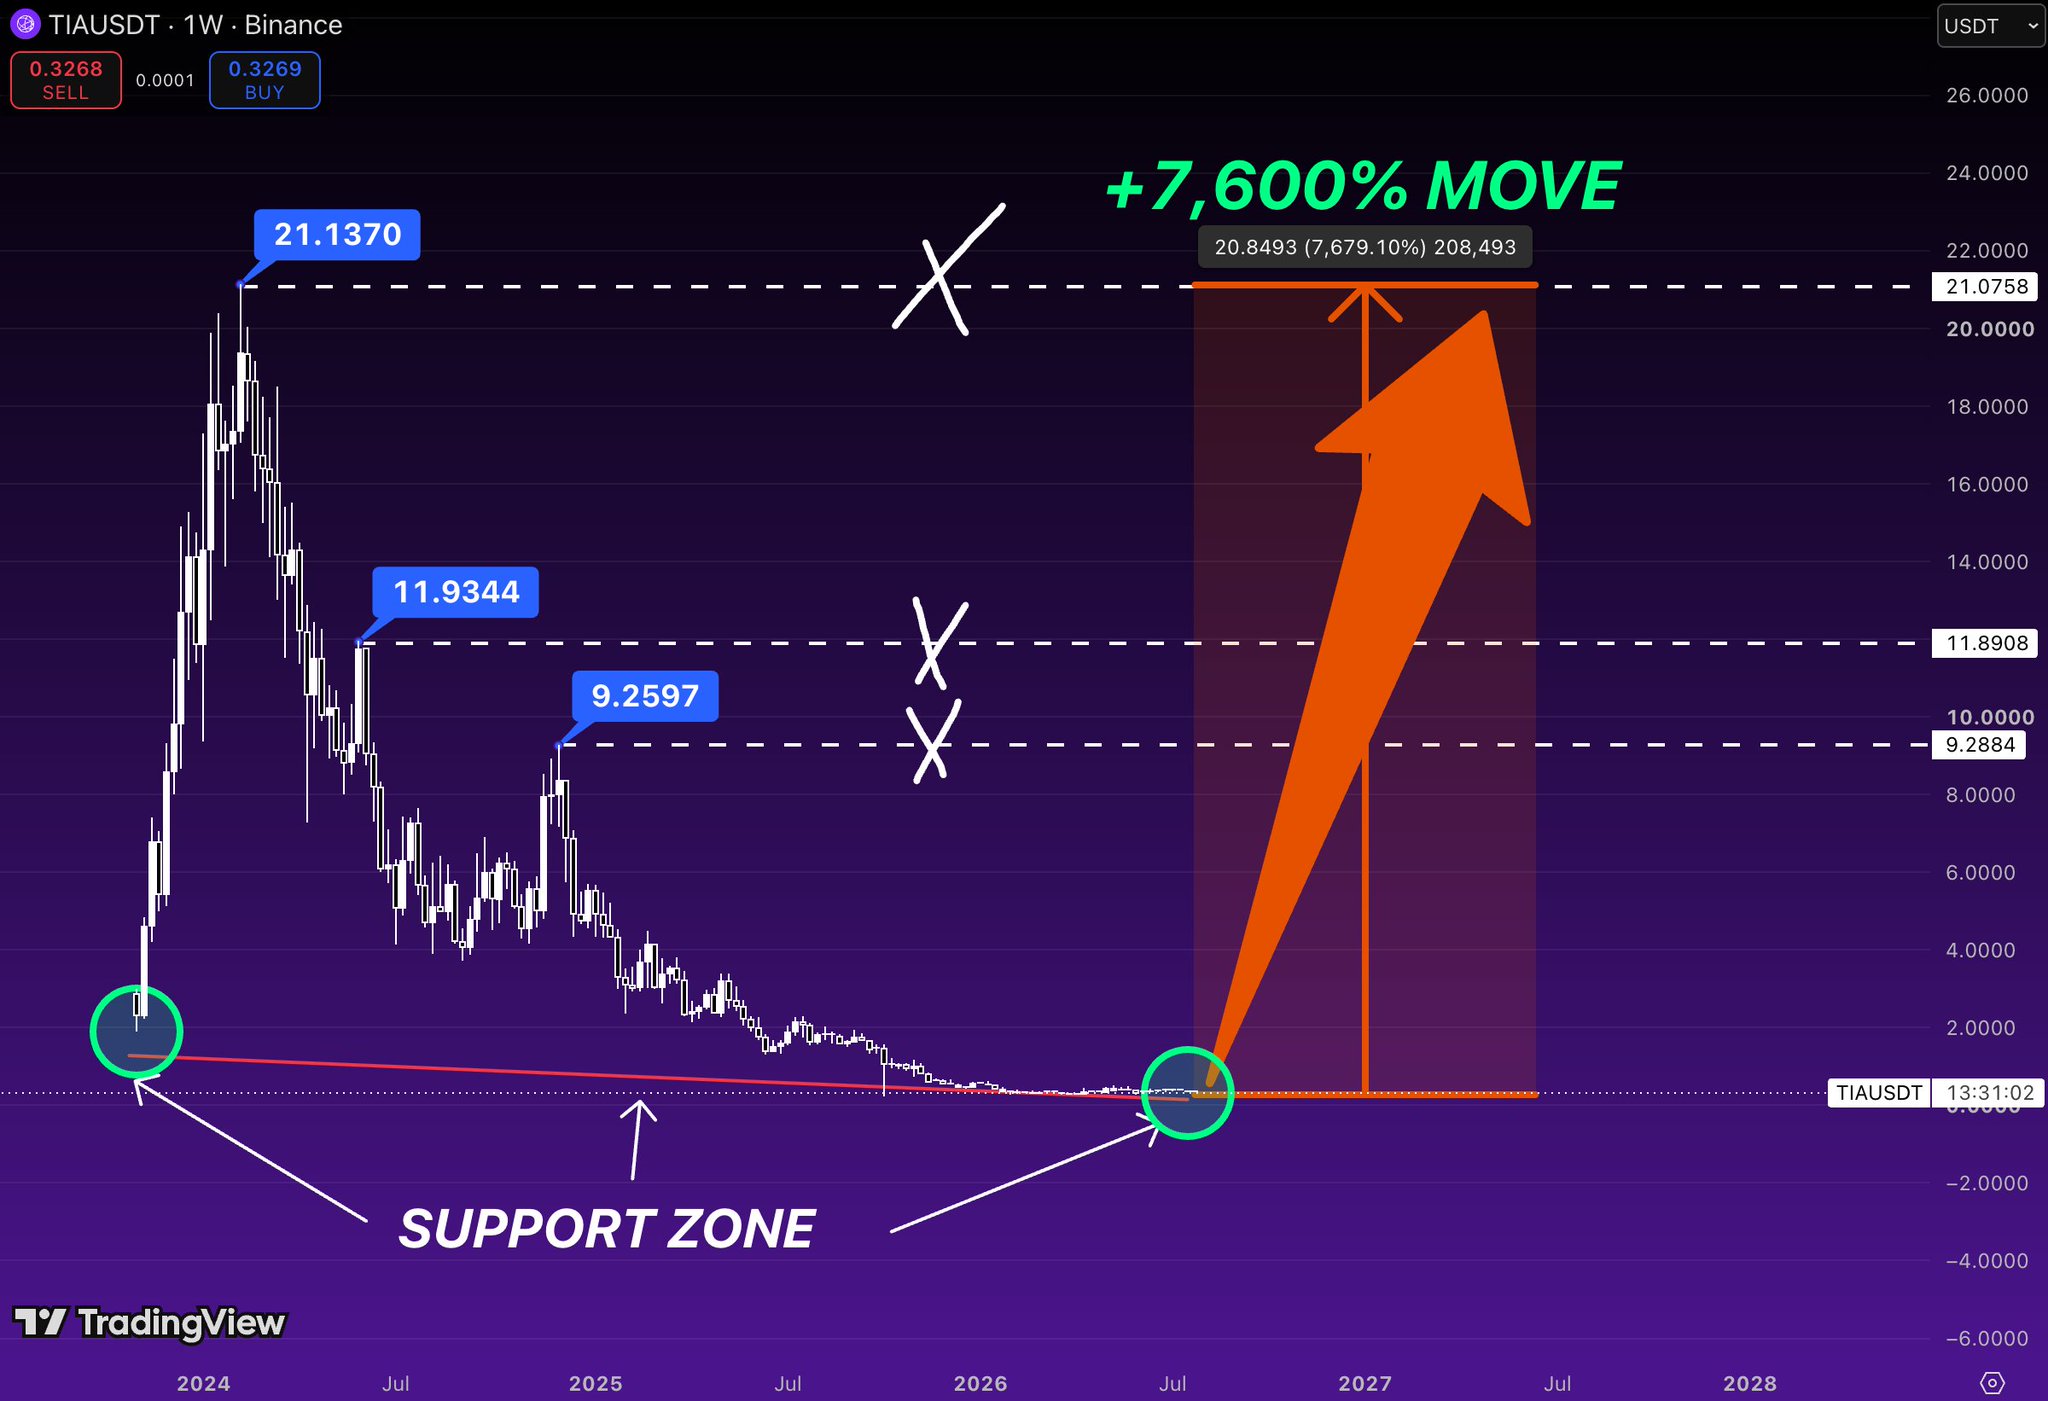
Price has spent almost two years bleeding into a major support zone.
Not crashing.
Not making new panic lows.
Just slowly transferring coins from weak hands to patient buyers.
That’s how accumulation usually looks before the trend changes.
The first major objective sits around $9.30.
That’s where the market previously found heavy supply, so expect volatility there.
If buyers keep control, the next destination is $11.90.
Breaking that level would completely shift sentiment.
Suddenly everyone who called TIA “dead” starts looking for entries.
The final objective is obvious.
The previous all-time high near $21.
Markets love revisiting major liquidity levels.
Not because history repeats perfectly…
…but that’s where the largest pools of orders still exist.
The funny part is that a move from today’s prices back to ATH sounds unbelievable.
Until it starts happening.
Then the exact same people who ignored TIA below $1 begin chasing it above $10.
That’s how every cycle punishes impatience.
Right now, TIA doesn’t need hype.
It needs confirmation.
If this support continues holding, the risk-to-reward remains one of the most attractive setups across the altcoin market.
 116
9
4.1K
116
9
4.1K
 144.2K @kain
 lmfao.
 18.8K @jadler0
 Reposting from @howdymary/@howdymerry regarding @howdymary/@howdymerry/@sonofeli for visibility since their profile is private. Text transcluded below.
---begin---
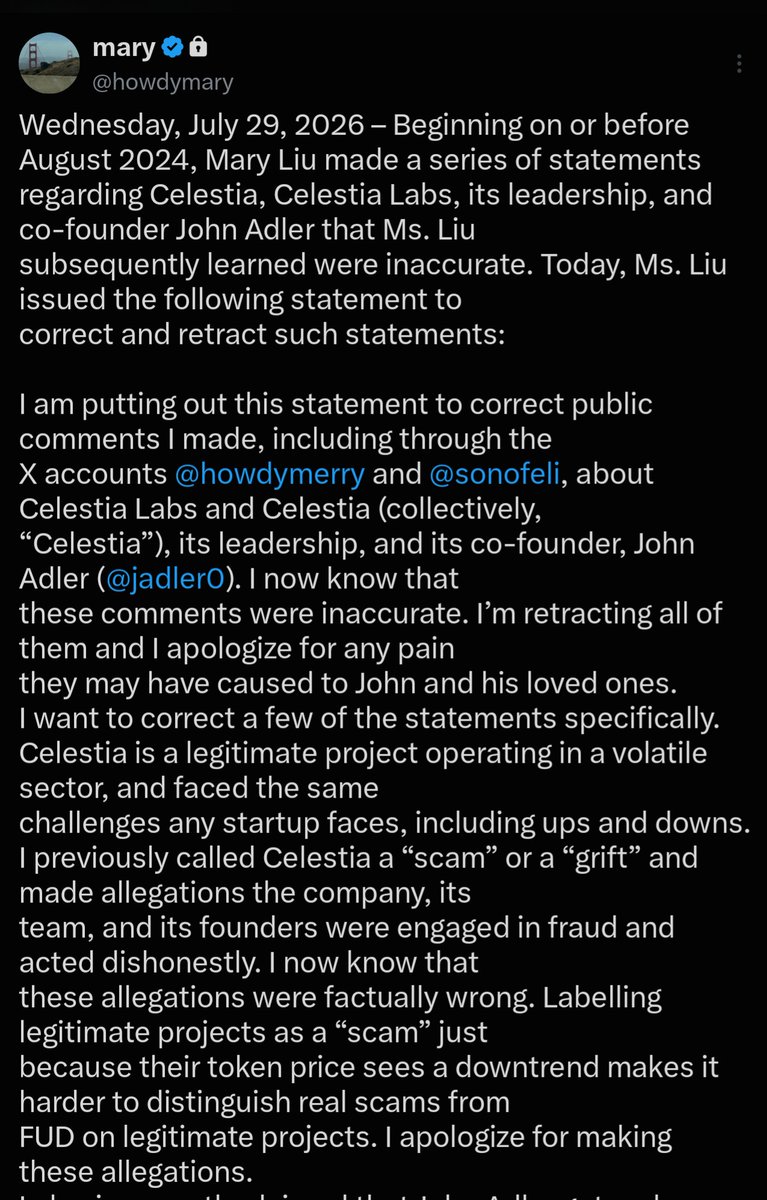
Wednesday, July 29, 2026 – Beginning on or before August 2024, Mary Liu made a series of statements regarding Celestia, Celestia Labs, its leadership, and co‑founder John Adler that Ms. Liu subsequently learned were inaccurate. Today, Ms. Liu issued the following statement to correct and retract such statements:
I am putting out this statement to correct public comments I made, including through the X accounts @howdymerry and @sonofeli, about Celestia Labs and Celestia (collectively, “Celestia”), its leadership, and its co‑founder, John Adler (@jadler0). I now know that these comments were inaccurate. I’m retracting all of them and I apologize for any pain they may have caused to John and his loved ones.
I want to correct a few of the statements specifically.
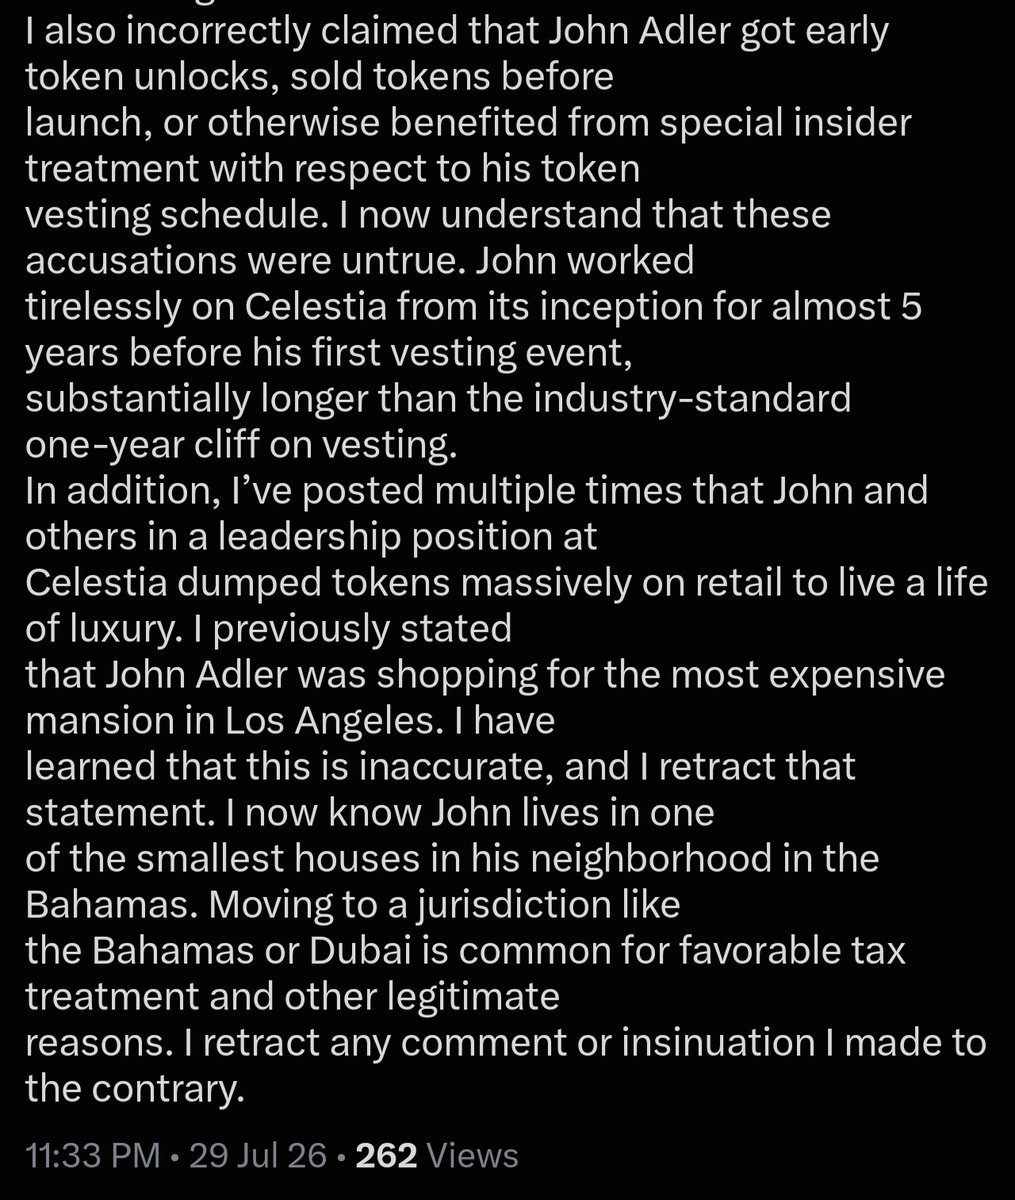
Celestia is a legitimate project operating in a volatile sector, and faced the same ch
 20
7
8.5K
20
7
8.5K
