GM fellow harvesters 🫡 https://t.co/8YzbU2KTeU


 127.9K @OGDfarmer
 GM fellow harvesters 🫡 https://t.co/8YzbU2KTeU
127.9K @OGDfarmer Everyone looking for robotic exposure, while those black berries look ripe for the picking.
Not claiming to be a tradfi genius, but I understand data. And when you combine it with narrative, $BB imho under the radar play of the year in the sector.
 28
28
 11
11
 4.3K
127.9K @OGDfarmer
4.3K
127.9K @OGDfarmer Everyone looking for robotic exposure, while those black berries look ripe for the picking.
Not claiming to be a tradfi genius, but I understand data. And when you combine it with narrative, $BB imho under the radar play of the year in the sector.
74
14
12.2K
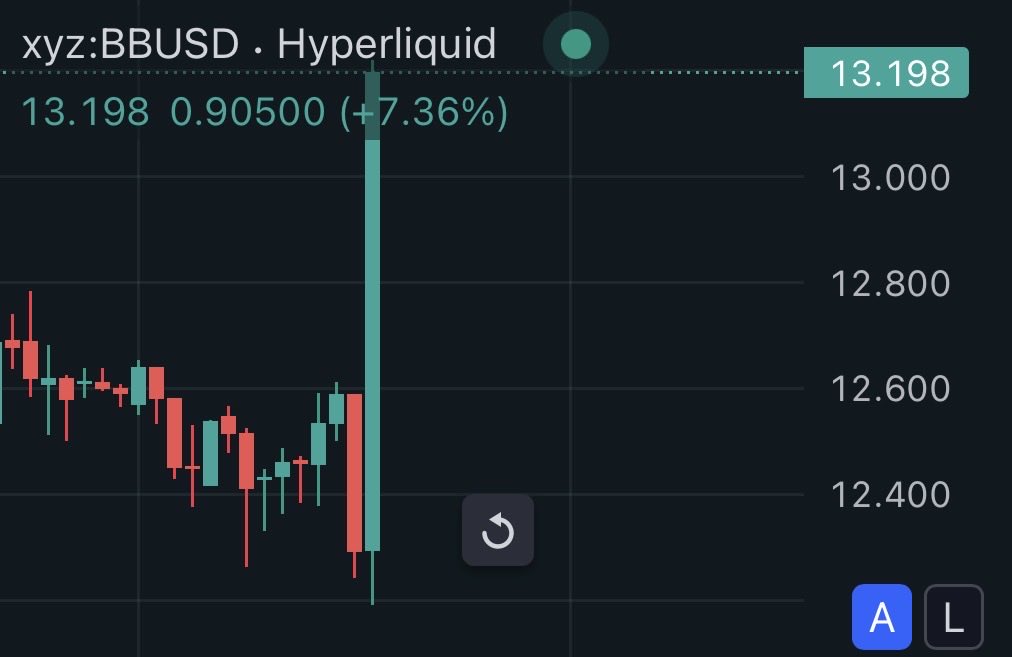
 28.3K @nottellingyou73
 🎯
28.3K @nottellingyou73 Great spot to reload on $BB
Has been consolidating nicely around $9 resetting the RSI before it makes its next move up
If I were to guess, their earnings call next Thursday will be a key catalyst to send this to $12-$15 by mid-July
15
3
5.6K