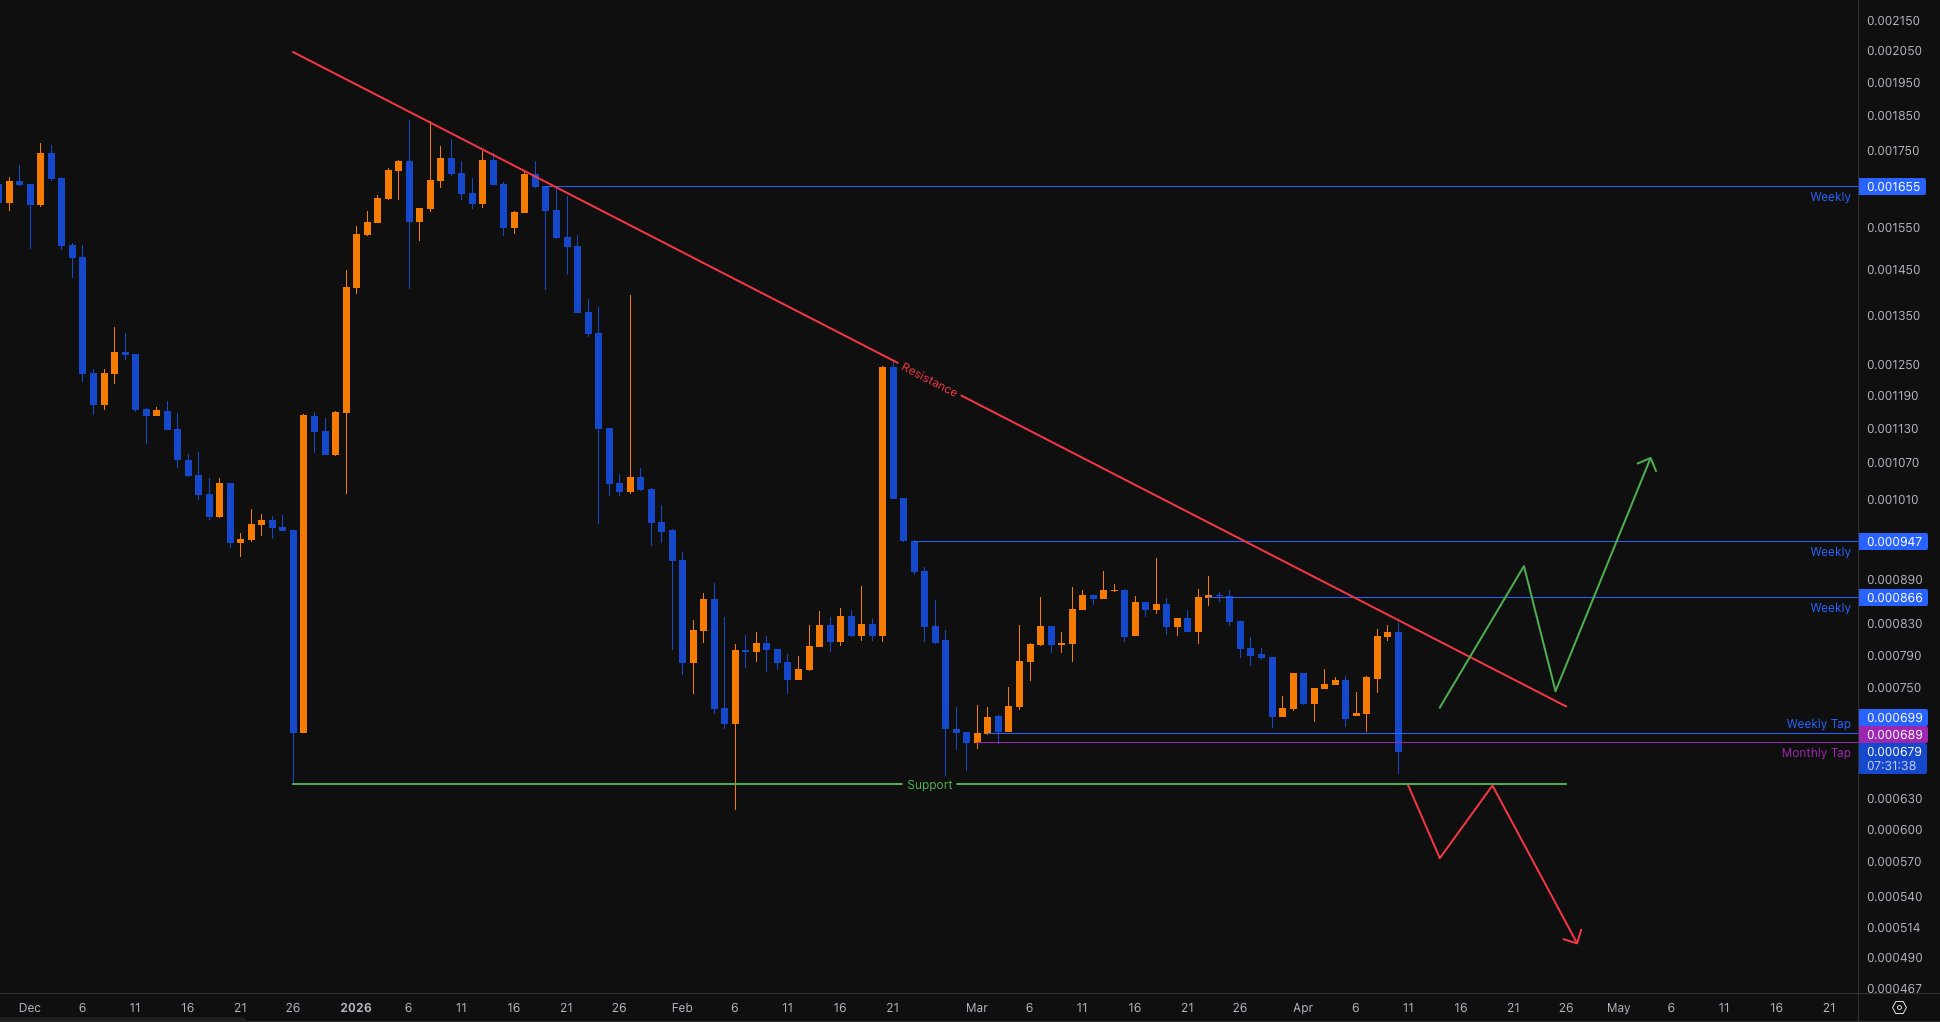
$BTSG with -20% drop today.
It's a very small cap project so very difficult to trade, but still can be observed
Possible scenarios if/when it leaves this "triangle structure"... https://t.co/Ov7SbGTOcc


 2.1K @IvanM10529875
 $BTSG with -20% drop today.
It's a very small cap project so very difficult to trade, but still can be observed
Possible scenarios if/when it leaves this "triangle structure"... https://t.co/Ov7SbGTOcc
 4
4
 0
0
 187
2.1K @IvanM10529875
187
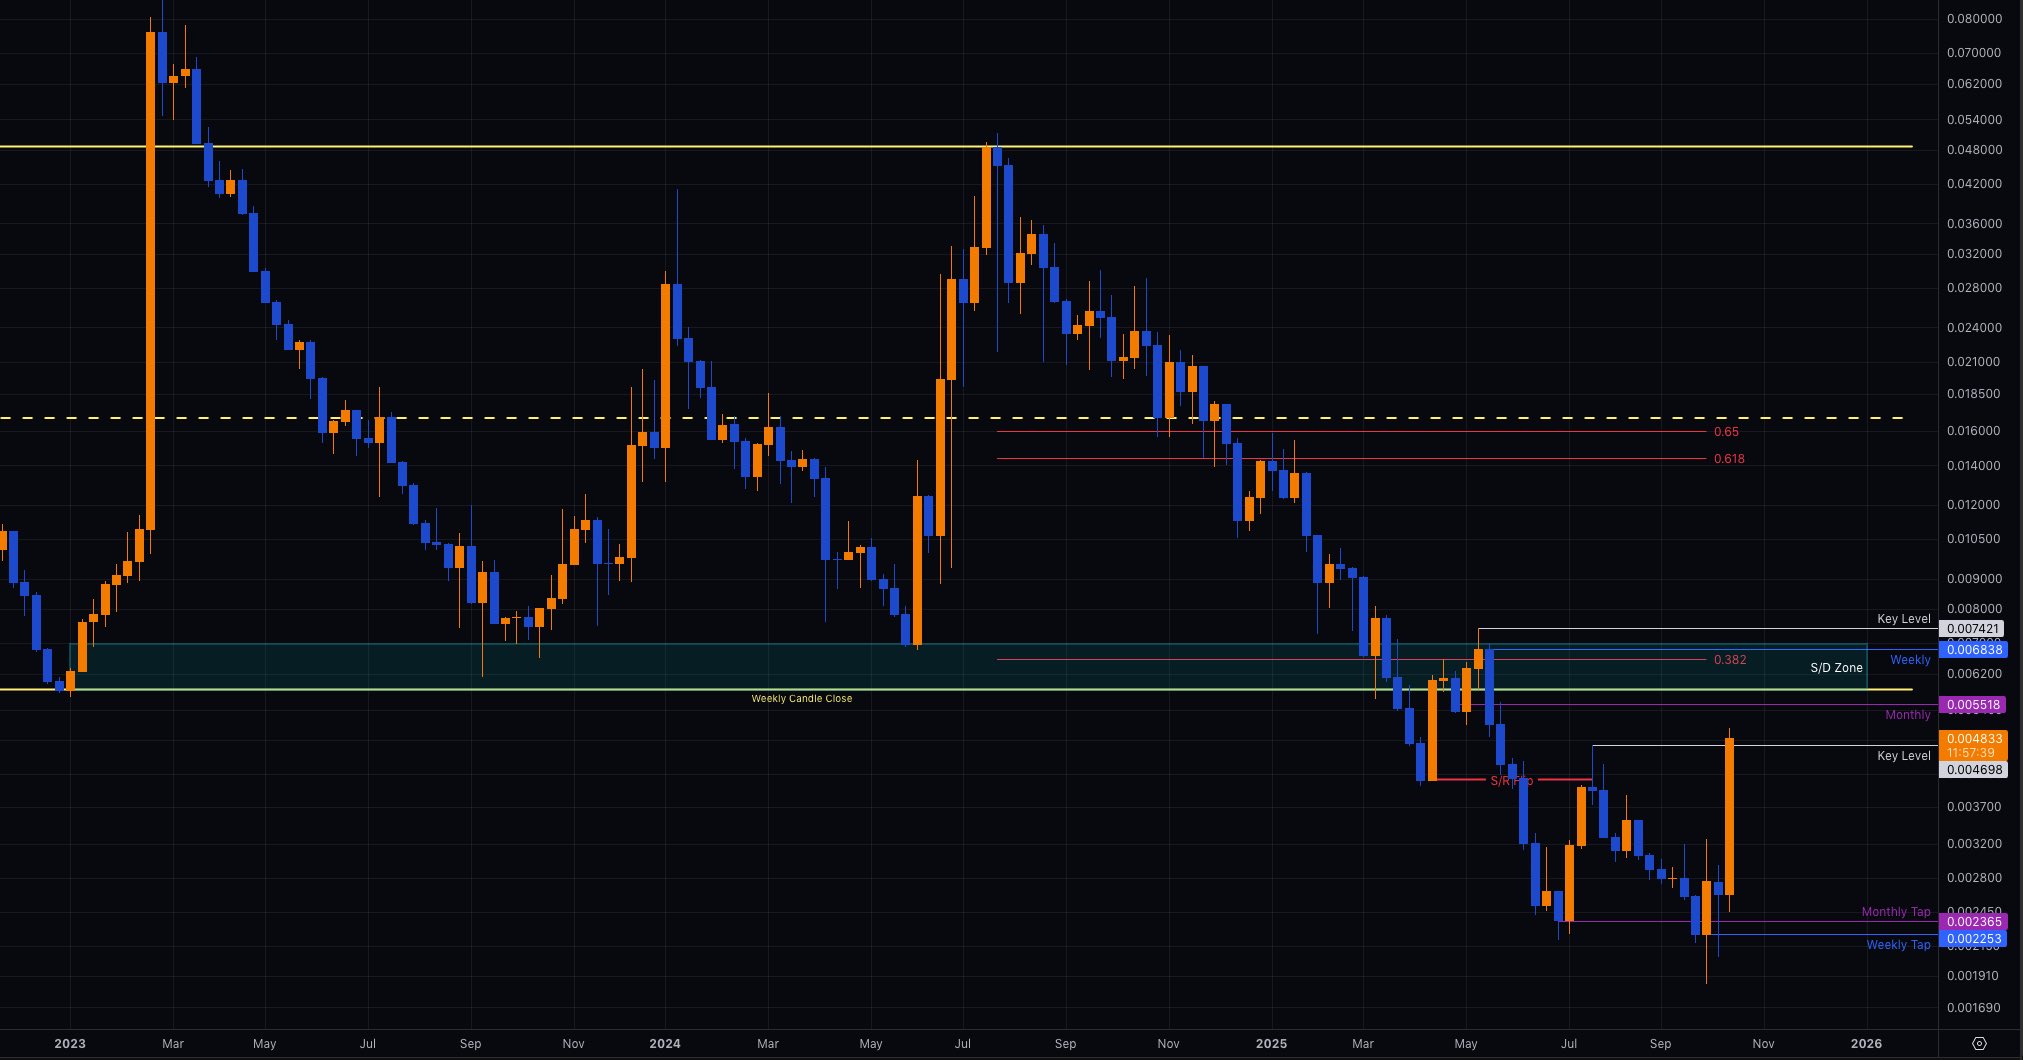
2.1K @IvanM10529875 $BTSG, Weekly TF
A good run this week!
After the rejection (and S/R Flip) on July 21st the price took the liquidity and Monthly Level and had a retest of the Weekly for an overall pump of around above 100%.
Currently is "figthing" with the first Key Level to try to change the Market Structure on the Weekly TF.
Major resistance around 0.55~0.7 cents where the bottom of the channel is as well as a few other levels. Reclaiming that could open the path to 1.5 cent or so.
 1
0
218
1
0
218