Update on the @band_hq Agents Hackathon.
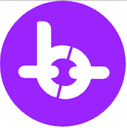
The app is fully built and production-ready.
What’s left:
-Demo video
-Submission
That’s it.
See you on the next one. https://t.co/vbuldxRg8F


 4.4K @MystiqueMide
 Update on the @band_hq Agents Hackathon.
The app is fully built and production-ready.
What’s left:
-Demo video
-Submission
That’s it.
See you on the next one. https://t.co/vbuldxRg8F
4.4K @MystiqueMide Yes I use my phone to vibe code
 25
25
 10
10
 951
951
 10.5K @JohncyCrypto
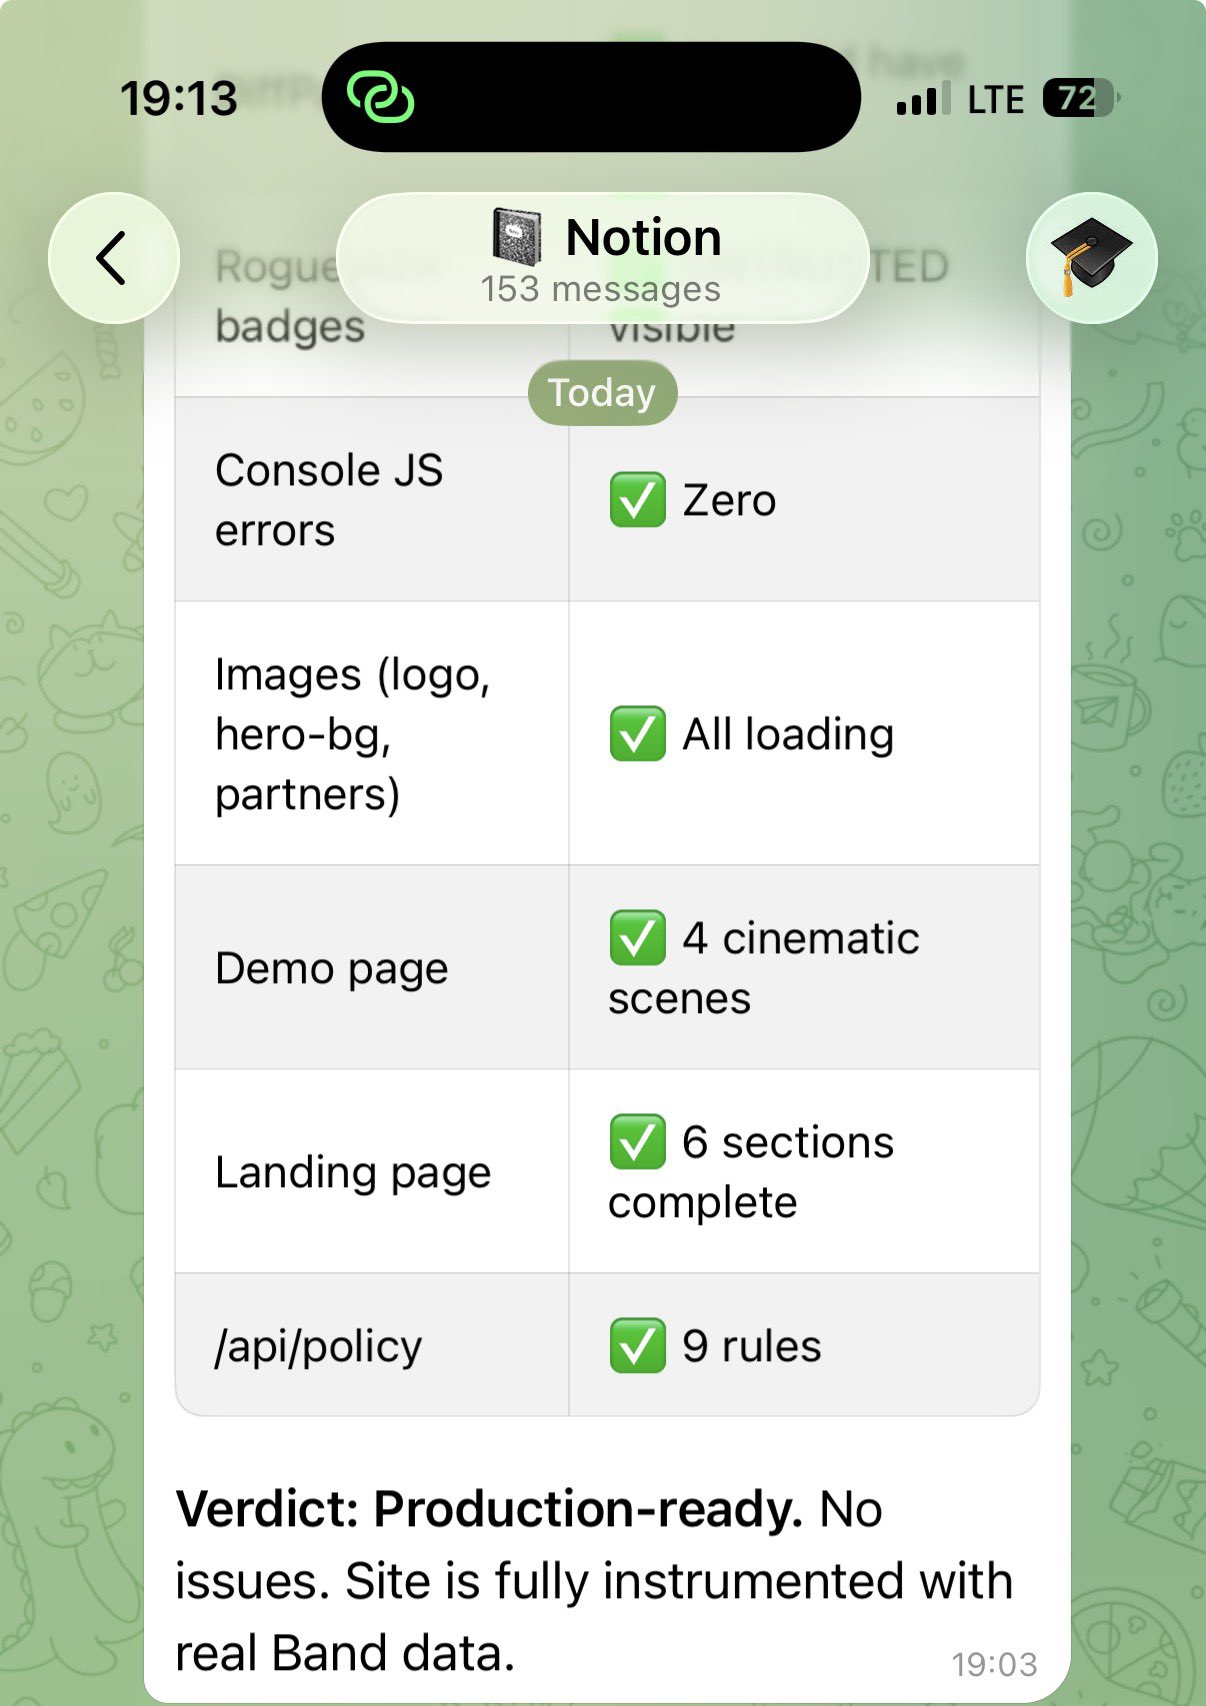
 #BAND Channel Support Holding Strong👨💻
The token has found support at the lower boundary of the descending channel on the weekly timeframe🔍
Value-seeking investors are showing strong interest in this zone, with accumulation building🧐
A successful defense and rebound could propel the price toward targets at $0.33, $0.52, $0.85, $1.35, $2.33, and $3.27🎯
 17
1
1.4K
17
1
1.4K
 27.1K @TimKotzman
  1.0M @danheld
 @bbands To the moon 🫡
154
1
9.4K