口座開設
QRコードでアプリをダウンロードする
iOS & Android

Artificial Superintelligence Alliance (FET)

$
$ 0.17 (FET/USD)
-5.25%
24H

Artificial Superintelligence Alliance ライブ価格データ

Artificial Superintelligence Allianceの今日の価格は$ 0.17 (FET/USD)です。 時価総額$ 395.19M USD 24時間取引量$ 878.02K USD 24時間の価格変動-5.20% そして流通供給量2.26B FET

Artificial Superintelligence Alliance FET 価格履歴 USD

Artificial Superintelligence Allianceの今日、7日間、30日間、90日間の価格を追跡
期間
24H変動幅
24H変動率 (%)
本日
$ 0.0096
-5.25%
7日
$ 0.0027
1.63%
30日
$ 0.027
-13.62%
90日
$ 0.060
-25.69%

FETを今すぐ所有

BitMartでFETを簡単に安全に売買できます。
今すぐFETを購入/売却
今すぐ{0}を購入/売却
Artificial Superintelligence Alliance 相場情報
最終取引価格 $ 0.17
$ 0.17 24H変動幅 $ 0.18
過去最高値
‎$ 0.99‎
過去最安値
‎$ 0.11‎
24H変動幅
‎-5.20%‎
24H取引高
‎$ 878,024.94‎
供給量
2.25B FET
時価総額
‎$ 395.19M‎
最大供給量
2.71B FET
完全希薄化後時価総額
‎$ 475.77M‎
取引 FET

稼ぐ

眠っている暗号資産を活用し、セービングやステーキングで安定収益を獲得。
今すぐ試す
今すぐ試す

Artificial Superintelligence Alliance Xインサイト

avatar
FET chart structure may have a technical rebound, but environmental factors reduce the setup’s attractiveness, target $0.1833‑$0.1859.

Does anyone have the double advantage for FET on their radar at all?

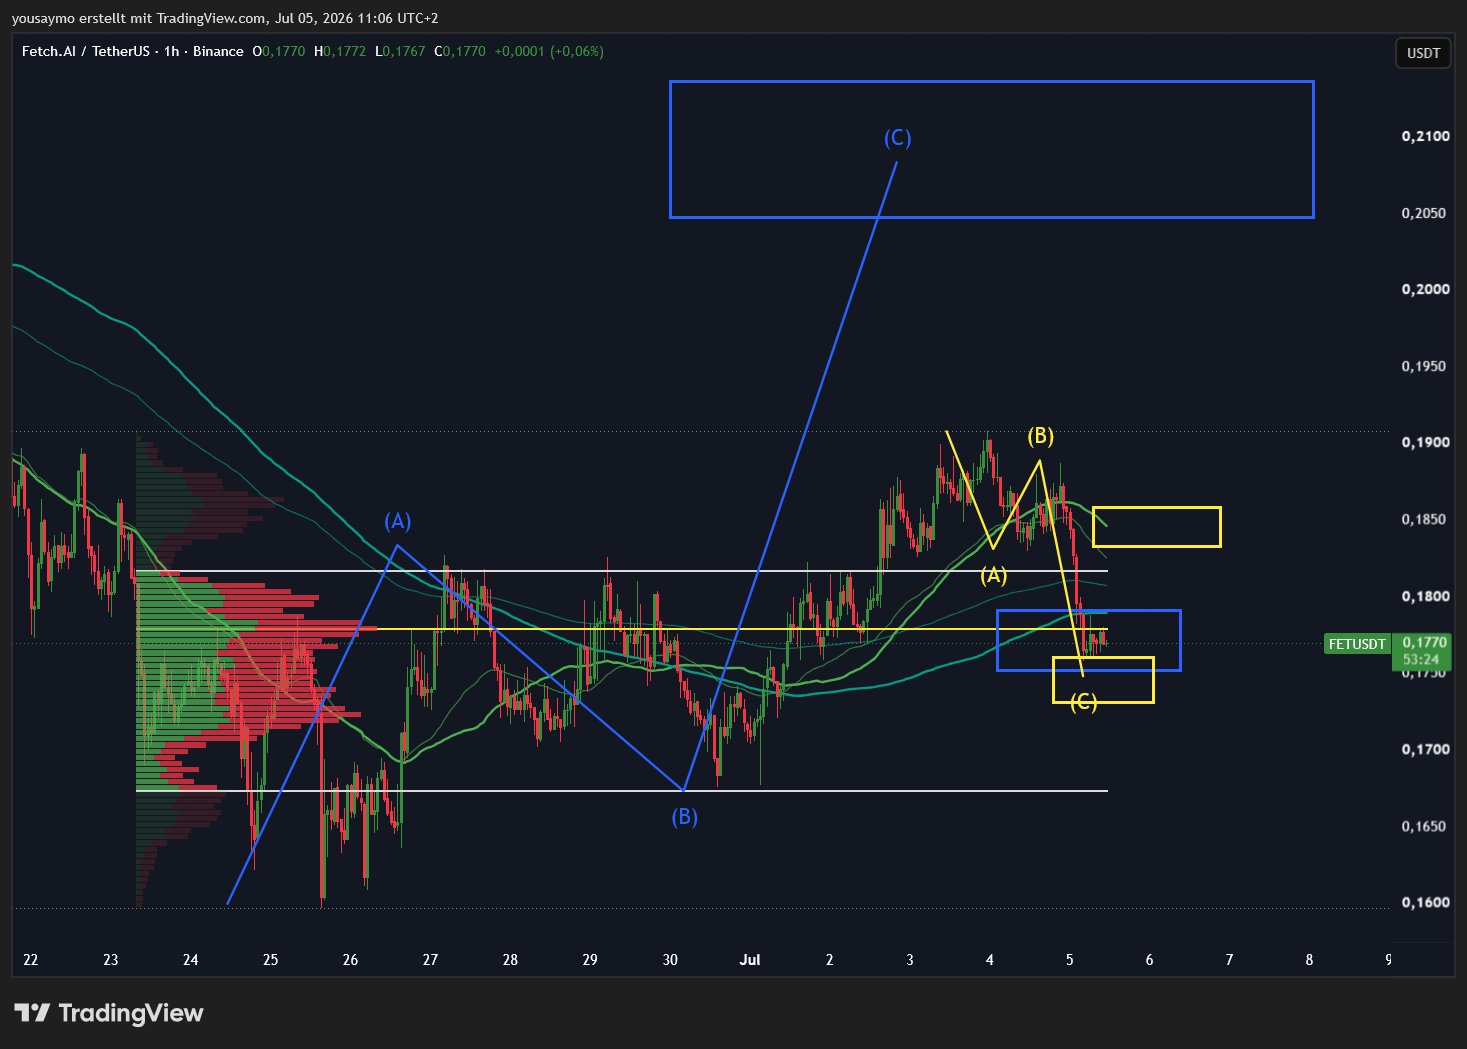
Structurally, I like the current chart picture. We are running in the dark‑blue structure and have simultaneously reached the BC correction level. The bearish move has already worked through its 161.8% target. Statistically, we often see at least a technical counter‑reaction from such areas.

What I absolutely do not like, however, is the surrounding environment. The Point of Control was lost to the downside and all relevant EMAs and SMAs are currently above the price. That makes an otherwise interesting setup clearly less attractive.

This is also a good example of why I never look at just a single system. The chart structure leans more toward a recovery, but the volume profile and the moving averages dampen that probability. If the Point of Control as well as the EMAs and SMAs were below the price, I would consider the setup considerably higher quality.

If the counter‑reaction still comes, the first interesting target range for me is between $0.1833 and $0.1859.

Exactly these kinds of constellations show why confluence ultimately matters more than any single signal. If you enjoy insights like this and want to learn more about the combination of chart analysis, volume profile and market structure, feel free to leave some interaction and follow me.

view 105
view 11
view 5.9K
2026-07-05 09:27
リリース後のFETのトレンド
中立
FET chart structure may have a technical rebound, but environmental factors reduce the setup’s attractiveness, target $0.1833‑$0.1859.
avatar
FET has been trading within a converging structure for months, awaiting a breakout to determine its future direction.

🔷️ $FET has spent months trading inside a narrowing structure, with both sides of the market gradually losing momentum as price approaches the apex of the formation.

📉 Unlike earlier periods where volatility expanded aggressively after each move, recent candles suggest the market is entering a compression phase rather than a directional one.

🟣 The converging purple trendlines continue to define the dominant structure, while 🟢 the green support zone below remains the key area buyers have managed to defend. 🟡 The yellow regions above still represent the major barriers for any stronger recovery attempt.

With the range becoming increasingly tight, the next reaction around this compression zone could play a major role in shaping FET's next higher timeframe move.

⚠️ Not financial advice.

#FET #FetchAI #AI #Crypto #Altcoins

view 85
view 25
view 6.8K
2026-07-05 03:57
リリース後のFETのトレンド
中立
FET has been trading within a converging structure for months, awaiting a breakout to determine its future direction.
avatar
FET is hovering near a key support level; if it holds, a long-term rise is expected.

$FET / $USD - Update

I want to see the bulls put up more of a fight, but this is the level to hold for a long up. https://t.co/SDZghXANqI

view 167
view 19
view 22.6K
2026-07-04 18:17
リリース後のFETのトレンド
強気
FET is hovering near a key support level; if it holds, a long-term rise is expected.
詳細確認

価格予測

FETを購入するのに良い時期はいつですか?FETは今買いでしょうか、売りでしょうか?

Artificial Superintelligence Alliance(FET)を購入または売却する適切な時期を決定する際は、まずご自身の取引戦略とリスクプロファイルに合わせることが重要です。長期投資家と短期トレーダーは市場状況を異なる方法で解釈することが多いため、決定には個人的なアプローチを反映すべきです。 最新の FET 4時間テクニカル分析によると、現在の取引シグナルは ホールド です。 最新のFET1日テクニカル分析によると、現在のシグナルはホールドです。
53
ホールド
FETの4時間テクニカル分析
最終更新 2026-07-05 07:59:59
52
ホールド
FETの1日間テクニカル分析
最終更新 2026-07-06 00:00:00
beacon

ビーコン予測

の確率的価格予測(今後24時間)
i
ビーコン予測に関する免責事項
このページに表示されるデータ結果は、選択した取引ペアの実際の取引データ(OHLCV)と対応するテクニカル指標に基づいて分析されています。
この予測は実験的な技術的成果であり、あくまで参考目的で提供しています。これは投資アドバイスをではありません。現実世界での予期せぬ出来事が市場行動に大きな影響を与える可能性があります。トレーダーは慎重に意思決定を行うべきです。
アプリバージョン Artificial Superintelligence Alliance
Artificial Superintelligence Alliance (FET) is a cryptocurrency launched in 2018. Artificial Superintelligence Alliance has a current supply of 2,714,384,546.672 with 2,258,907,271.21929299 in circulation. The last known price of Artificial Superintelligence Alliance is 0.17807202 USD and is up 3.11 over the last 24 hours. It is currently trading on 567 active market(s) with $92,876,200.47 traded over the last 24 hours. More information can be found at https://superintelligence.io/.
続きを読む
購入 FET
取引 FET