$HOOD
Daily candle getting bought up…
Watching for a close over the 9EMA on the daily
Looks like it’s ready for takeoff https://t.co/P0FcwBuDS0


 26.5K @enrichtrades
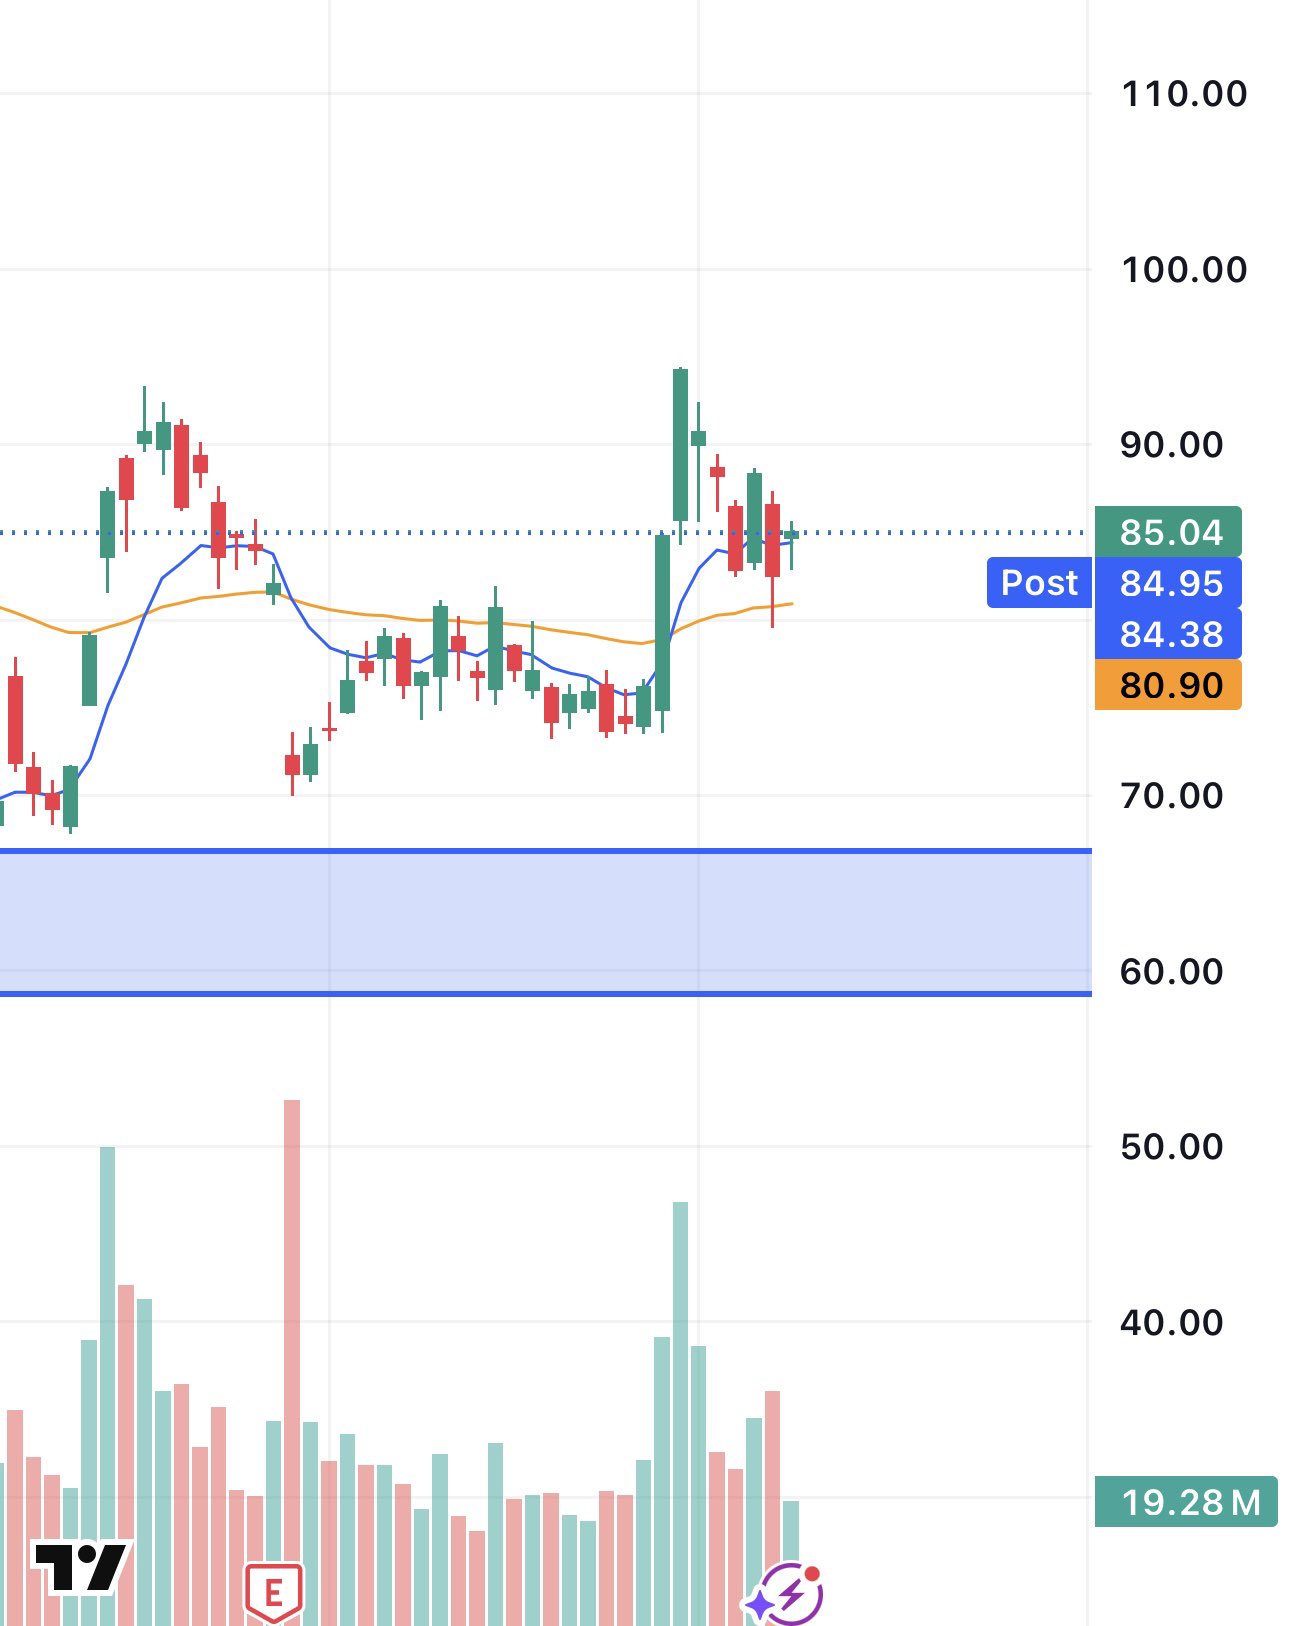
 $HOOD
Daily candle getting bought up…
Watching for a close over the 9EMA on the daily
Looks like it’s ready for takeoff https://t.co/P0FcwBuDS0
 66
66
 15
15
 3.5K
3.5K
 87.5K @cantonmeow
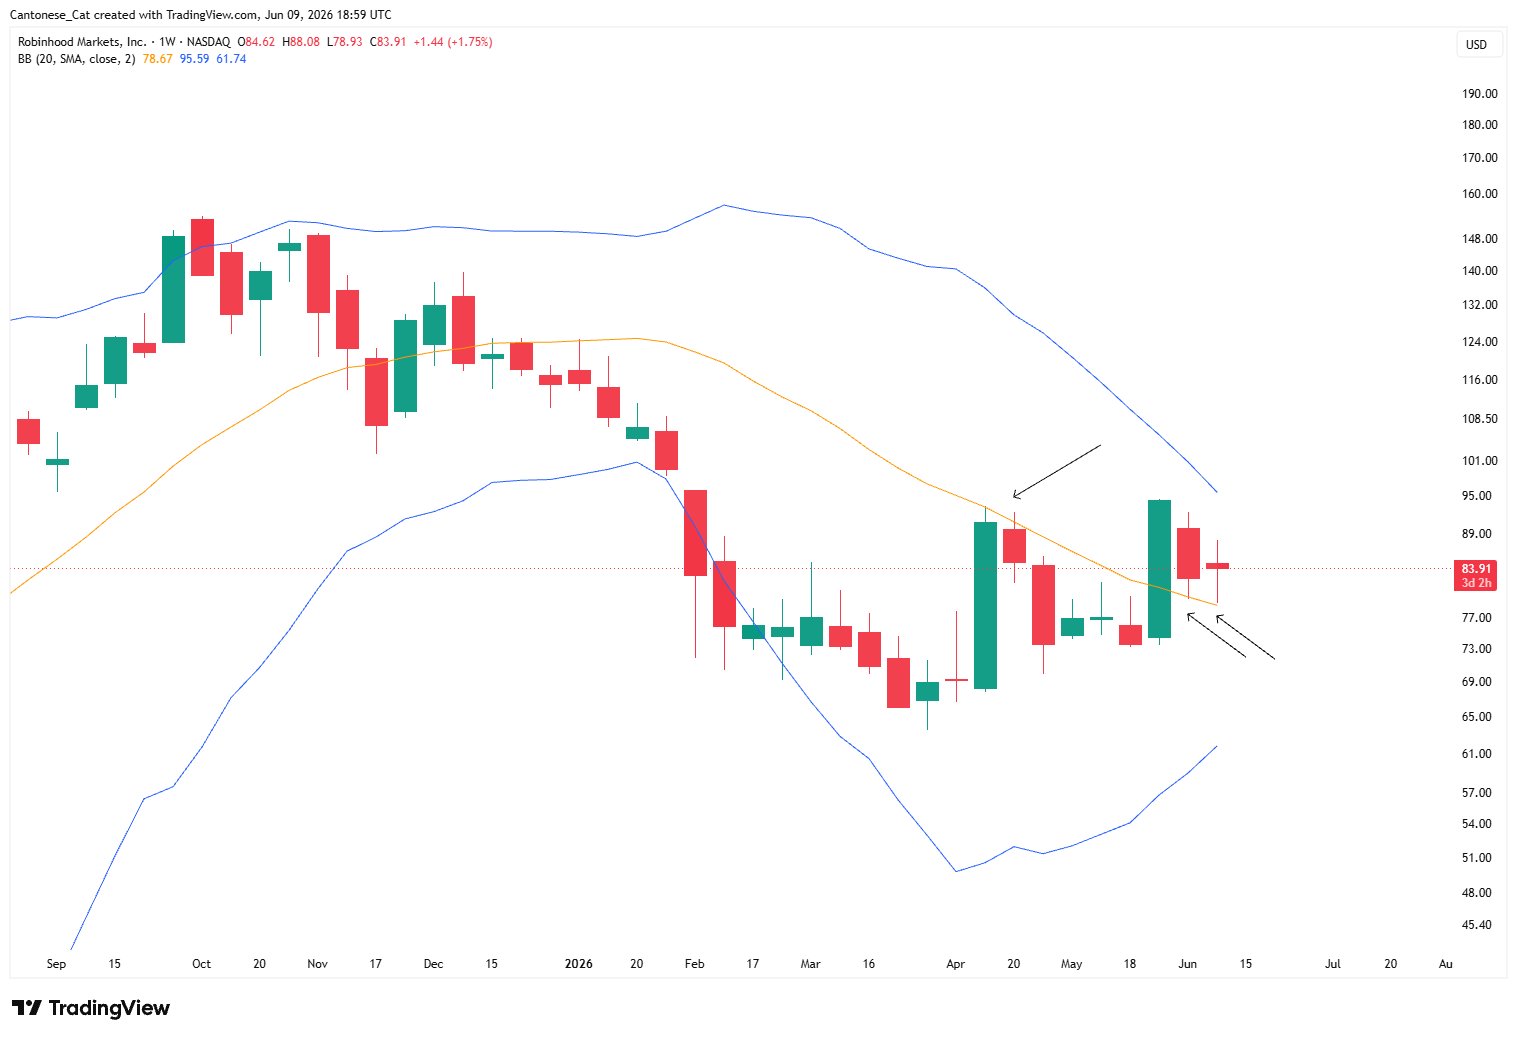
 I'm one of those that if you ask me if you could kiss me, as far as I'm concern, you already did.
I just wished that $HOOD's 20 week SMA would be flatter so it can be kissed harder. https://t.co/v8ykS0P6TE
 113
32
7.5K
26.5K @enrichtrades
113
32
7.5K
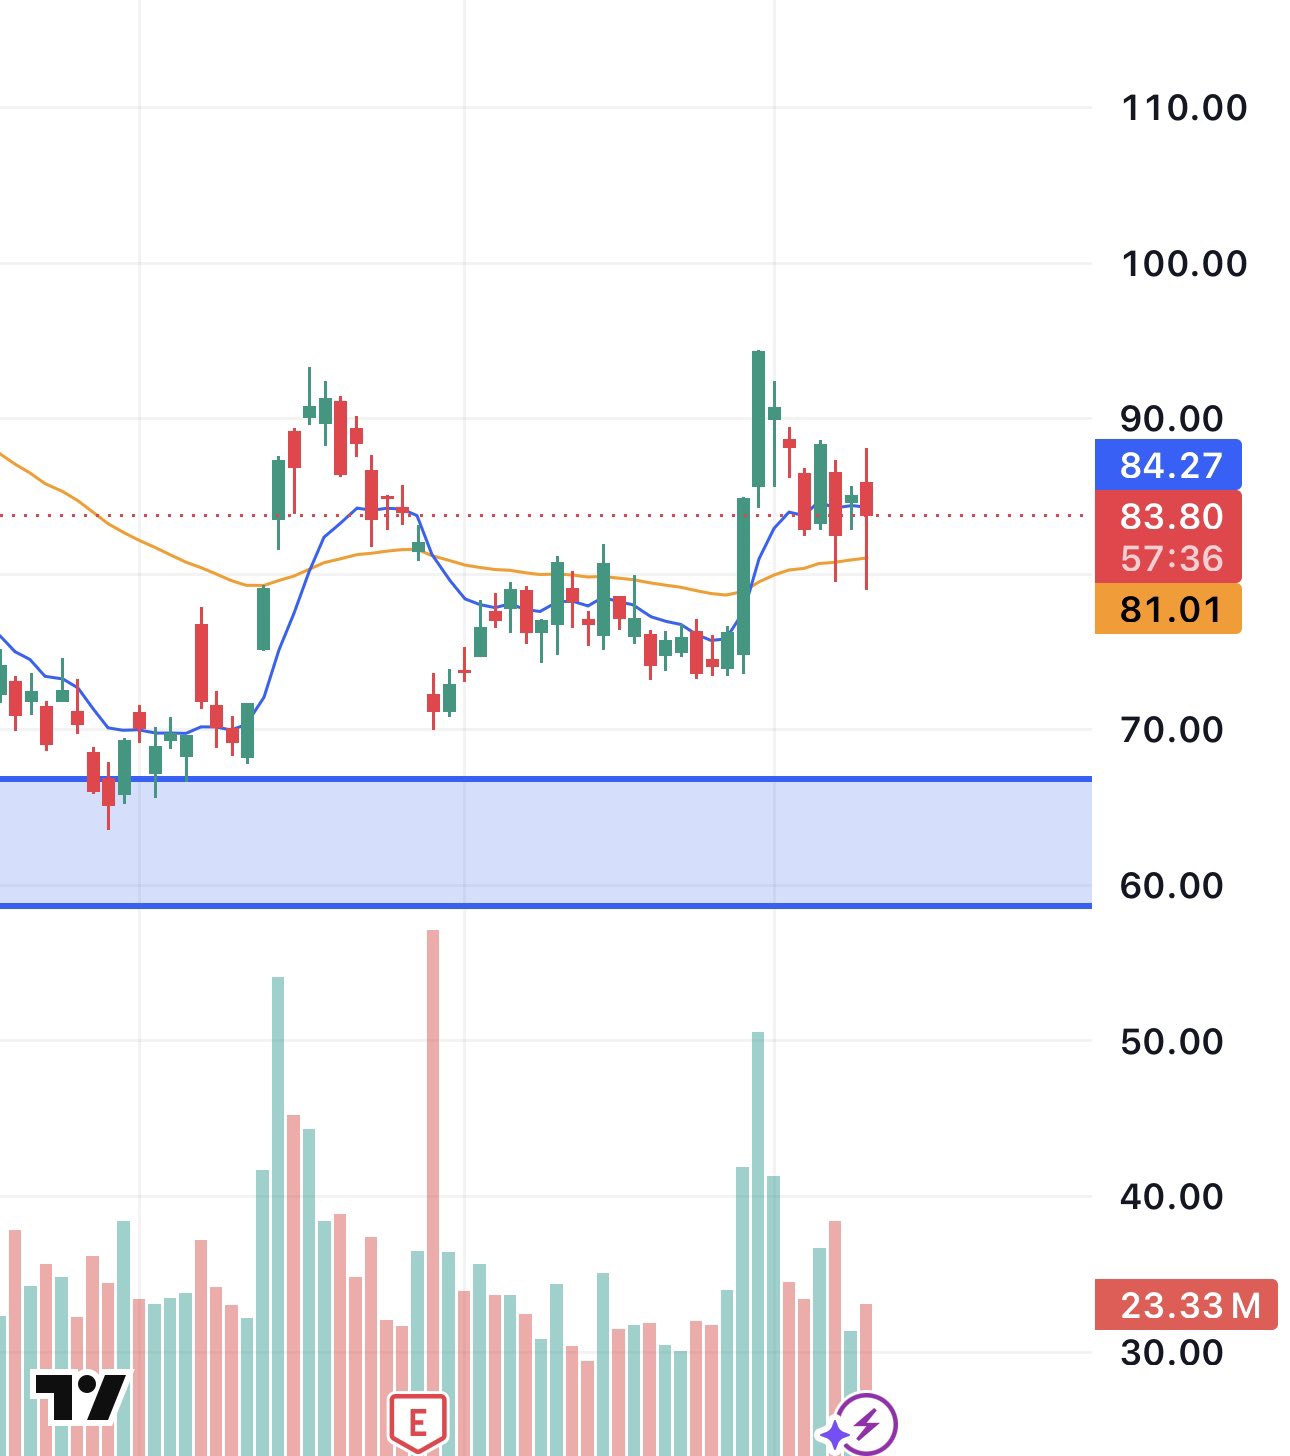
26.5K @enrichtrades $HOOD
Risk-reward is there for a clean daily candle tomorrow
Inside bar + close over 9EMA + low volume pullback
Let’s see if we can push back to $90+ by midweek https://t.co/SOtnRTvcYh
 101
8
11.6K
101
8
11.6K