$AI weekly
Reclaiming the Bull Market Support Band, but sure needs to flip this prior all-time low zone back to support for a bottom to likely be in
I don't have a position https://t.co/7zIg6xcb95
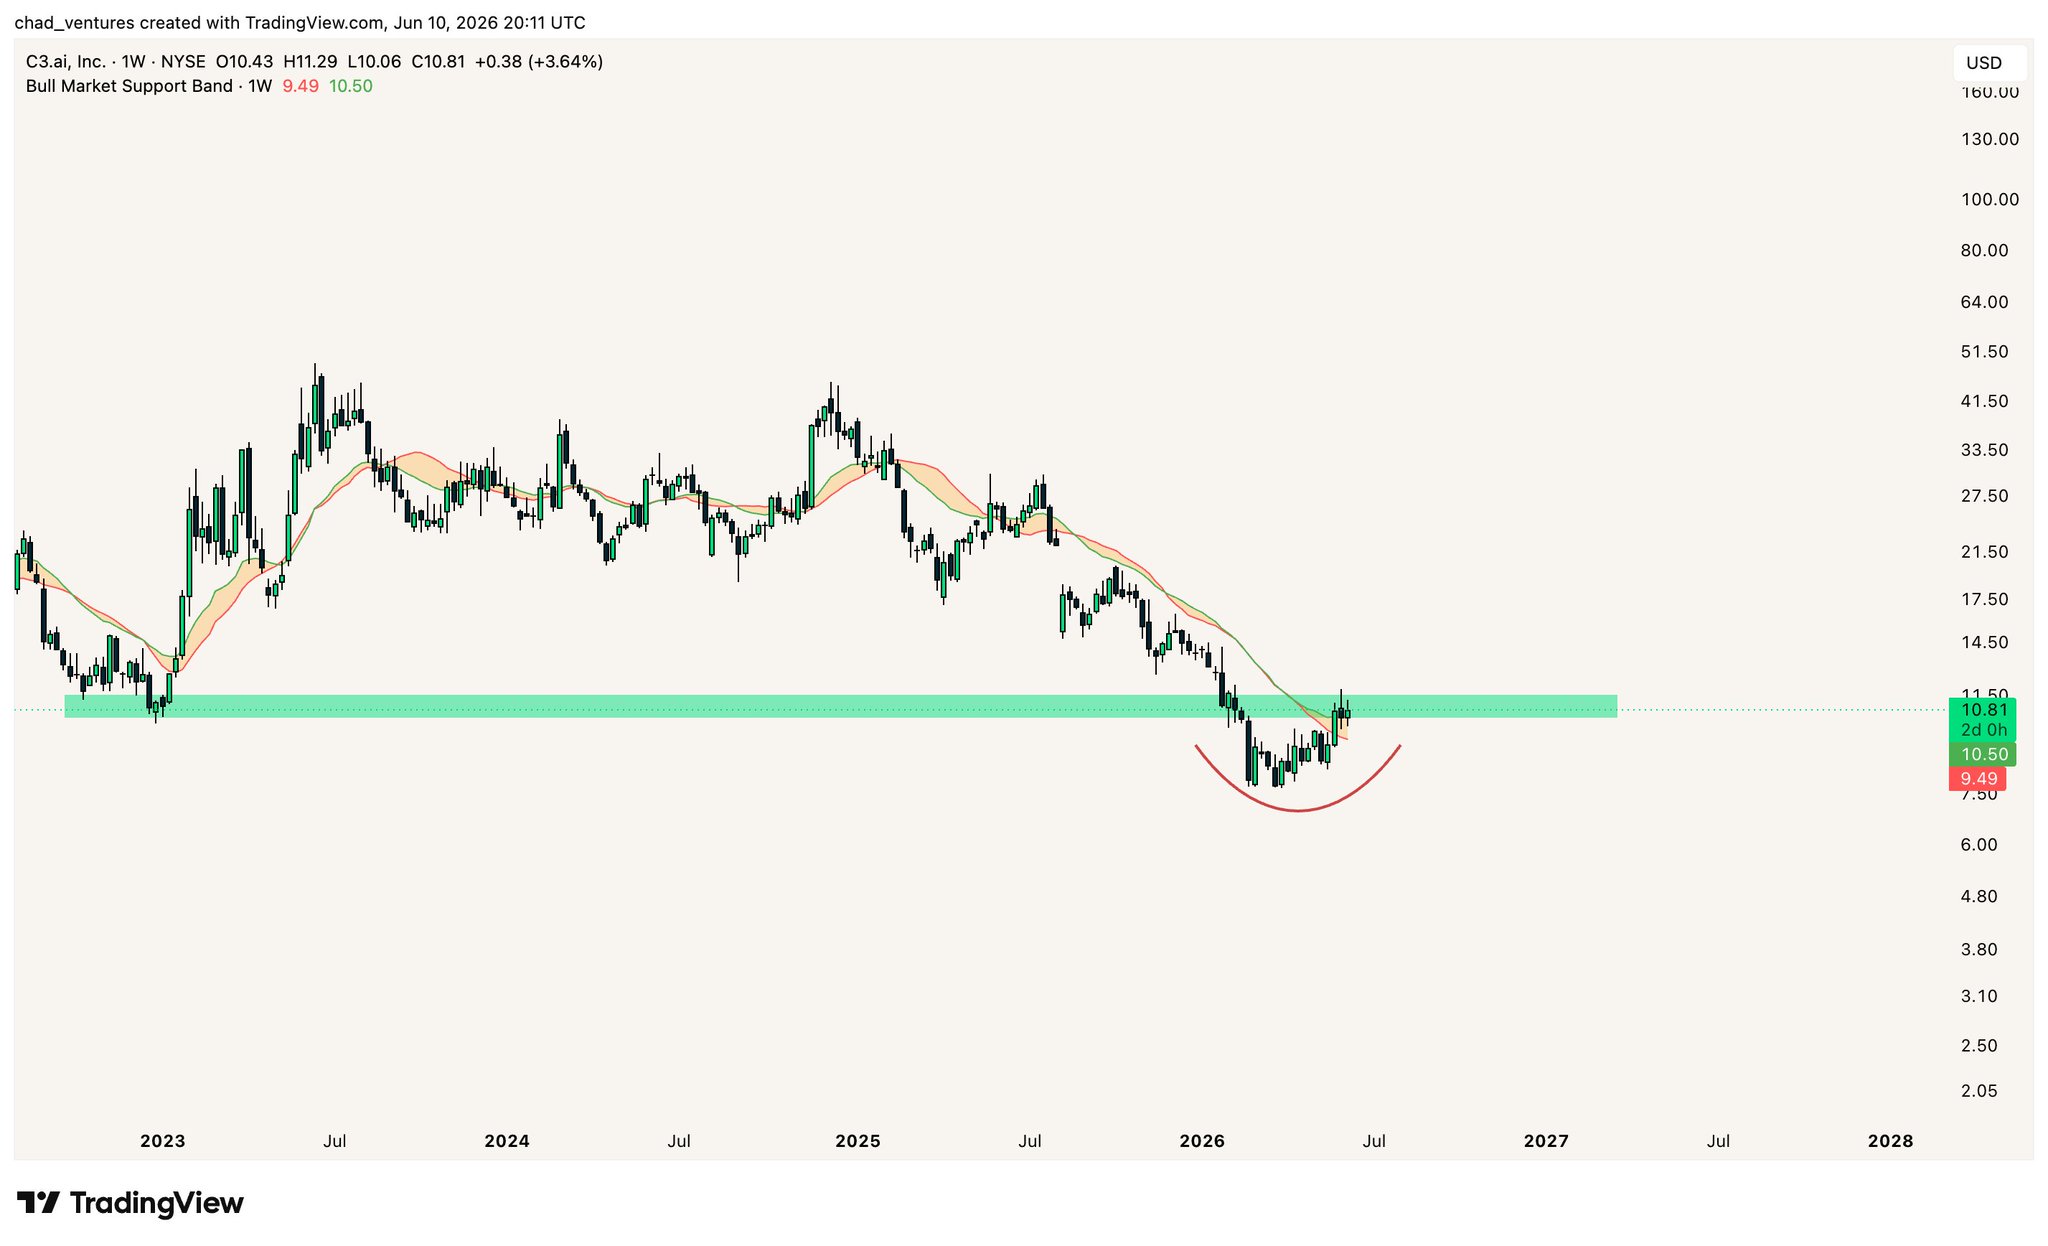


 21.3K @chad_ventures
 $AI weekly
Reclaiming the Bull Market Support Band, but sure needs to flip this prior all-time low zone back to support for a bottom to likely be in
I don't have a position https://t.co/7zIg6xcb95
 17
17
 14
14
 2.3K
2.3K
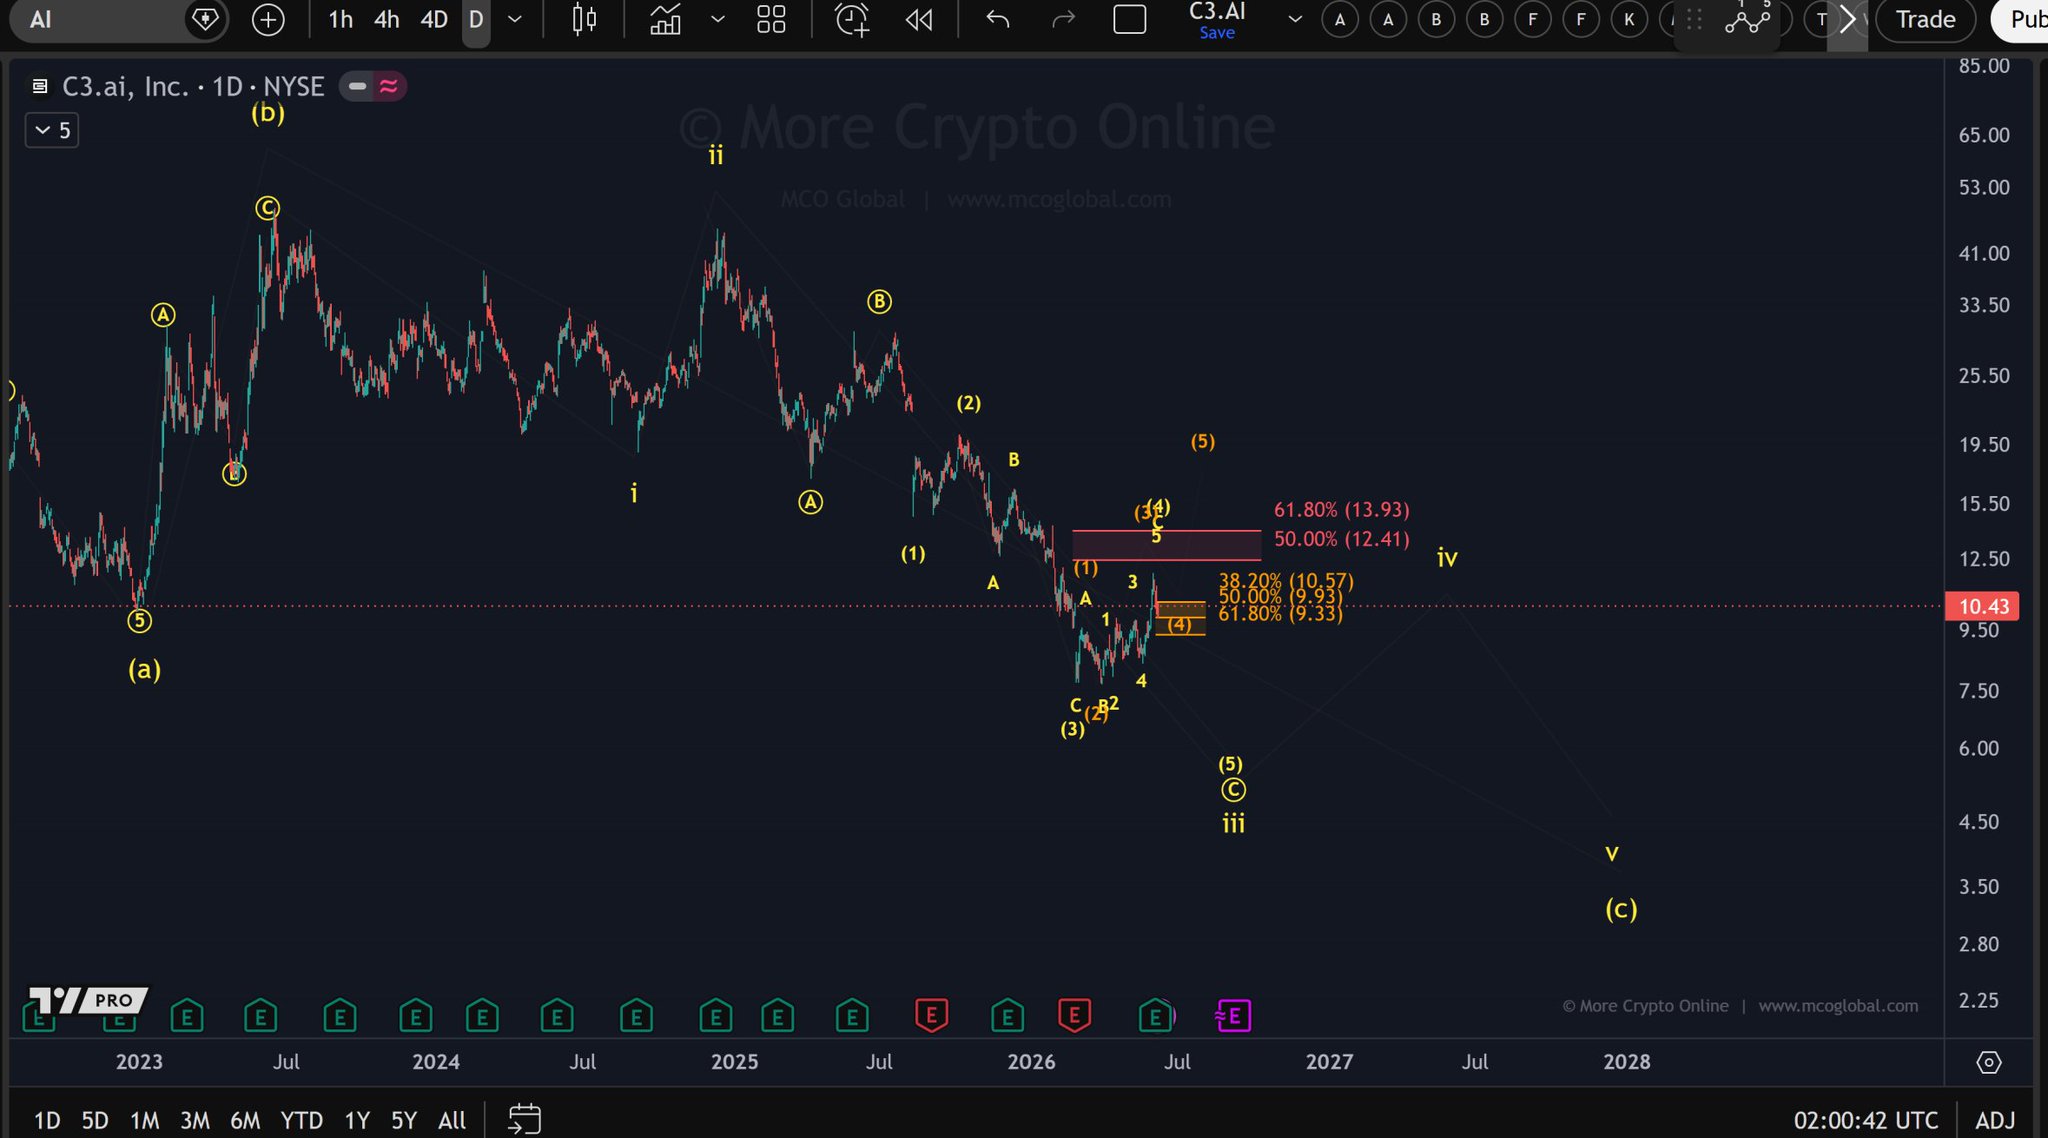
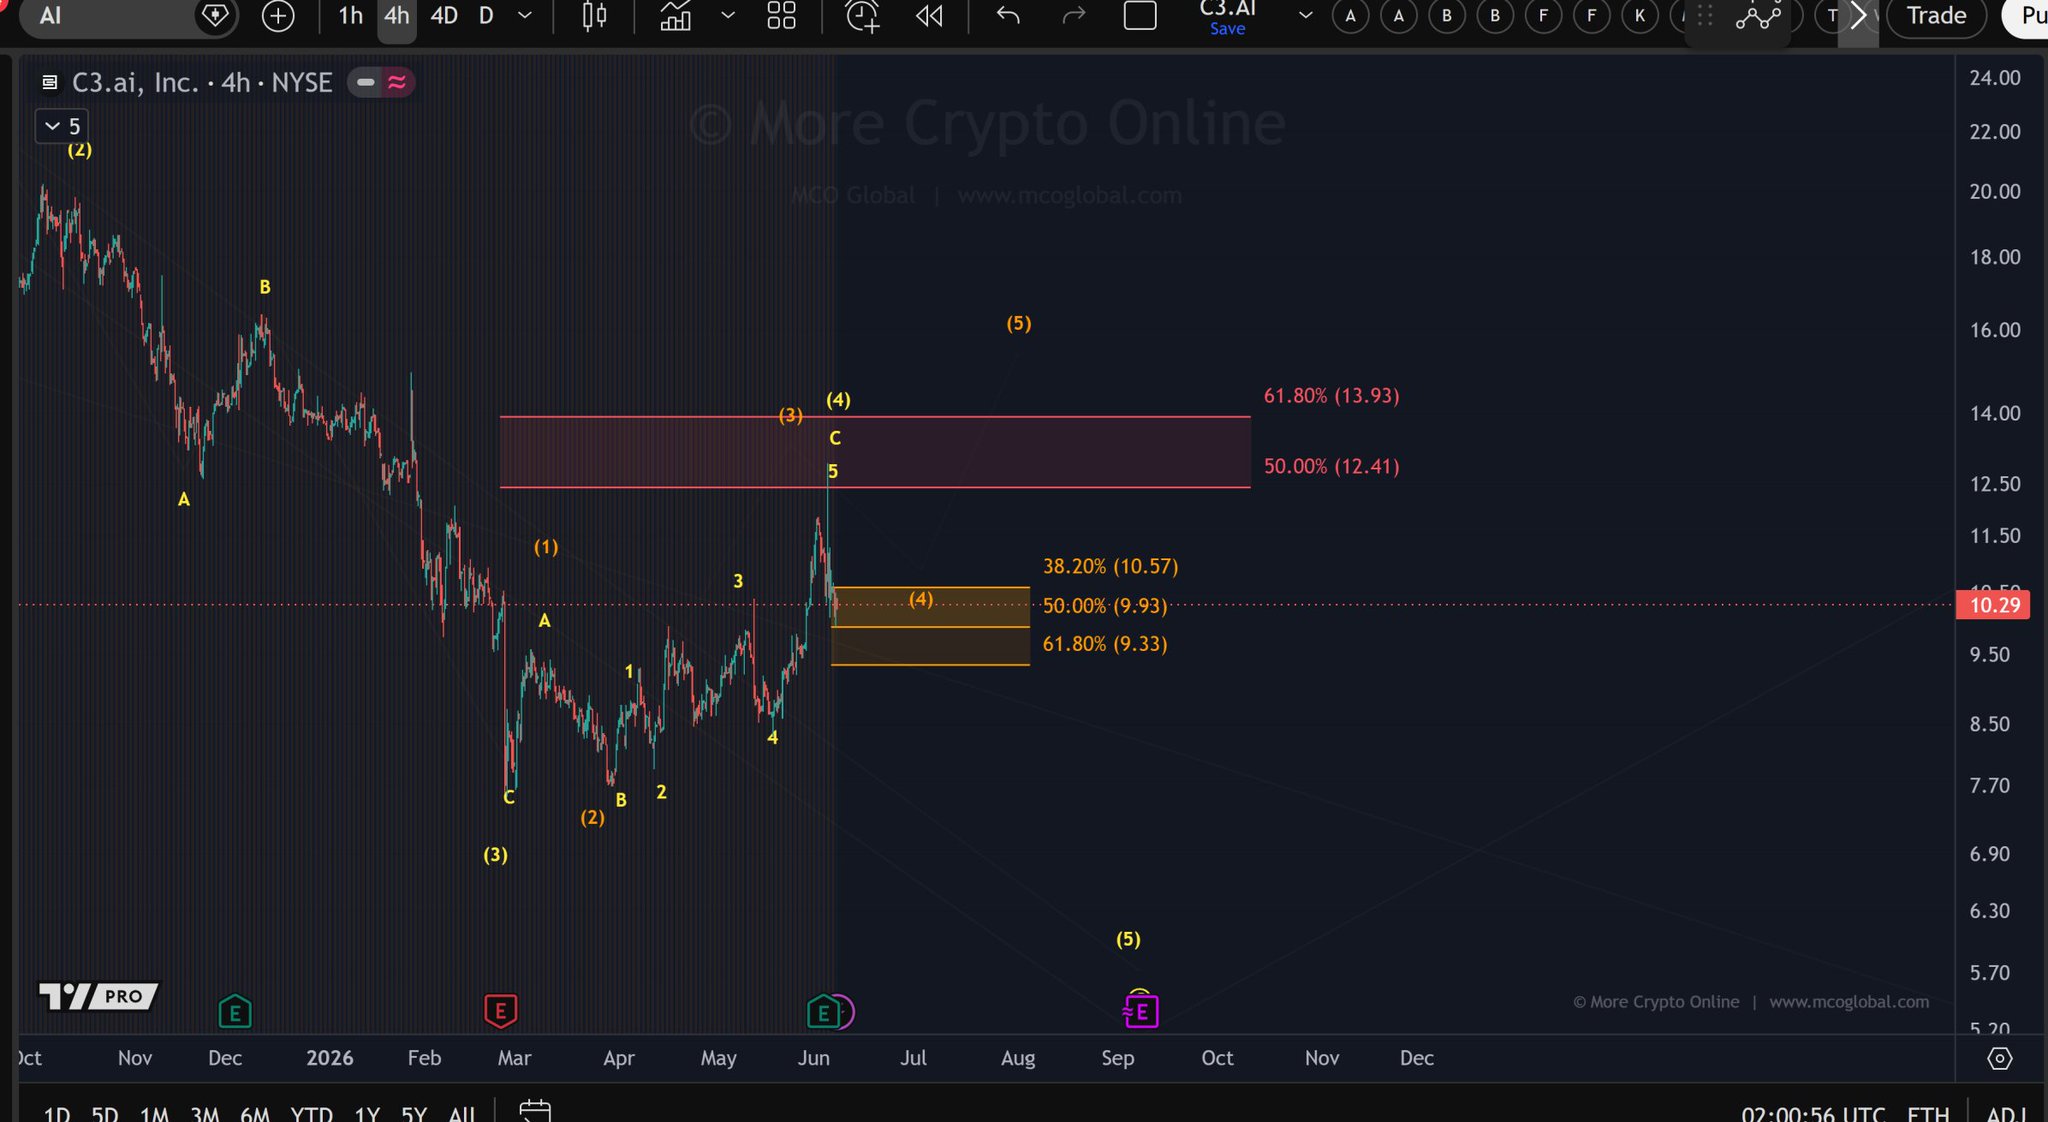
 7.3K @morecryptoDE
 $AI
The current structure continues to favor the yellow count, with the recent rally appearing incomplete from an Elliott Wave perspective. While the market has pulled back from its recent high, the additional upward extension required for a clear 5-wave structure is still missing. Leading scenario: The preferred yellow scenario assumes that the recent pullback is part of an ongoing correction wave (4) within a developing larger uptrend. Under this interpretation, another high remains likely to complete a 5-wave upward move. The orange support area between roughly $9.33 and $10.57 remains the most important zone to watch. As long as this support zone holds, the bullish alternative remains intact and further upward extension is possible.
Risk scenario: A sustained break below the orange support zone would significantly weaken the bullish interpretation and increase the likelihood that the recent high has already completed the rise. In this case, the market could enter a larger correction structure before another significant rally develops.
Key support levels: $10.57 / $9.93 / $9.33 Key resistance levels: $12.41 / $13.93
Conclusion: The yellow scenario remains preferred, as the current structure still seems to need another high to complete a clear 5-wave rise. The highlighted orange support region is now the decisive area. As long as support holds, the bullish alternative remains feasible and further upward extension remains possible. A break below support would weaken this interpretation and shift focus to a larger correction outlook.
 13
0
1.7K
13
0
1.7K
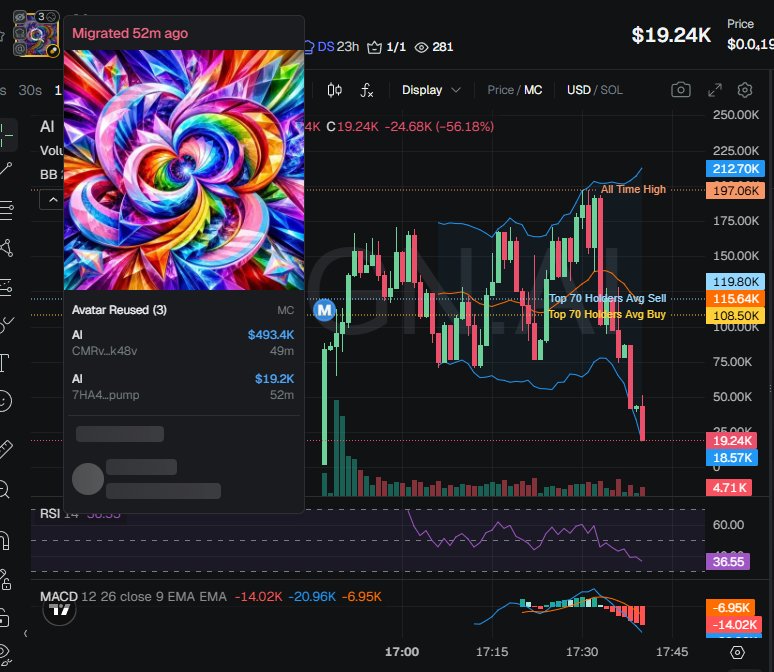
 54.0K @badattrading_
 $AI (CA 7HA4HXLTZ32HoCxUYaSaxDwkqVH6oeU98CFnc6cppump) is a bundled scam with gmgn and Terminal accounts, don't buy, stay away. https://t.co/3i4RaZgySp
 6
1
2.3K
6
1
2.3K