Empezar
Escanee para descargar la aplicación
para iOS y Android

LiveArt (ART)

$
$ 0.00029 (ART/USD)
0.00%
24H

LiveArt Datos de precios en tiempo real

El precio de hoy de LiveArt es de $ 0.00029 (ART/USD). Con una capitalización de mercado de $ 129.71K USD. Volumen de trading en 24 horas de $ 431.96K USD, Un cambio de precio en 24 horas de +0.00%. Y un suministro circulante de 432.80M ART.

LiveArt ART Historial de precios USD

Siga el precio de LiveArt para hoy, 7 días, 30 días y 90 días
Periodo
Cambiar
Cambio (%)
Hoy
$ 0
0.00%
7días
$ 0.000019
7.14%
30días
$ 0.000029
-9.09%
90días
$ 0.00017
-37.50%

Sea propietario de ART ahora

Compra y vende ART fácil y seguro en BitMart.
Comprar/Vender ART ahora
Comprar/Vender {0} ahora
LiveArt Información de mercado
Último precio $ 0.00029
$ 0.00029 Autonomía de 24 horas $ 0.00029
Máximo histórico
‎$ 0.049‎
El mínimo histórico
‎$ 0.00021‎
Cambio en 24 h
‎0.00%‎
Volumen en 24 h
‎$ 431,960.37‎
Suministros en circulación
432.79M ART
Market Cap
‎$ 129.71K‎
Suministro máximo
1.00B ART
Capitalización de mercado totalmente diluida
‎$ 299.70K‎
Trade ART

Ganar

Pon a trabajar tus criptomonedas inactivas y obtén ingresos pasivos a través de ahorros, staking y más.
Pruébelo ahora
Pruébelo ahora

LiveArt X Insight

avatar
LiveArt ($ART) airdrop claim page 404, project social media no longer updates, possibly dead.

Remember LiveArt airdrop?

If you forgot, let me remind you, the $ART airdrop from @LiveArtX had vesting, and based on the original schedule, the full unlock should’ve been done by May 14, 2026 (2 days ago).

But guess what...

Went to the claim page today and it just says "Page Not Found".

✅ Check here: https://t.co/9gRG4M3npI

Also looked at their X account. No new post since March 2026. Feels kinda lowkey dead.

If not, hopefully they respond to this soon.

view 257
view 51
view 33.4K
2026-05-15 22:27
Tendencia de ART tras el lanzamiento
Extremadamente bajista
LiveArt ($ART) airdrop claim page 404, project social media no longer updates, possibly dead.
avatar
Ultiland announces ARToken issuance mechanism upgrade, aiming to establish a long‑term sustainable asset system.

Ultiland Official Live | ARToken Issuance Mechanism Upgrade
From One-Time Launches to a Long-Term Asset System

🕗 Time: Jan 9, 20:00 (UTC+8)
📍 Venue: Ultiland Official Binance Live

Come and make an appointment 👇

https://t.co/OQn5SIIgeV

We’ll break down the two-phase trading structure, governance-triggered liquidity expansion, and what this upgrade means for long-term system durability.

🎁 Live-wide interactive perks will be dropping throughout the session.

view 51
view 43
view 669
2026-01-08 13:38
Tendencia de ART tras el lanzamiento
Alcista
Ultiland announces ARToken issuance mechanism upgrade, aiming to establish a long‑term sustainable asset system.
avatar
ART shows structural weakness and is bearish in the long run; BERA experiences a strong short-term rebound but remains in a corrective trend over the long term.

$ART is posting a mild intraday gain with a +0.91 percent move in the last 24 hours, but the overall price action remains choppy and directionless. The small uptick reflects a short-term bounce after price dipped into the 0.0048–0.0050 zone, an area that has acted as a soft support band throughout the week.

Zooming out, the higher-timeframe picture remains decisively bearish: -0.85% over 7 days, -17.84% over 14 days, -26.71% over 30 days, and -17.84% over 200 days. These consistently red readings show a sustained derisking phase with no confirmed base structure. When all higher windows print red while the 24-hour window barely flips green, it typically signals short-term relief rather than trend reversal.

The chart shows very volatile intraday spikes — brief upward wicks followed by immediate retraces — indicating thin liquidity and a lack of sustained buyer commitment. Price has been ranging tightly between 0.0050 and 0.0056, with sellers stepping in consistently whenever the upper band is tested.

Structurally, $ART remains weak: lower highs dominate, supports continue to erode, and the broader pattern shows no sign of accumulation. Even today’s bounce is likely driven by short-term volatility rather than a shift in market structure.

My view: $ART remains in a corrective environment with choppy, low-liquidity movement and persistent sell pressure. A meaningful recovery would require reclaiming the 0.0056–0.0058 zone and printing a higher low — neither of which is visible yet. Until then, upside moves are likely to be short-lived relief spikes within a broader downtrend.

$ART
Supported by @EdgenTech

avatar

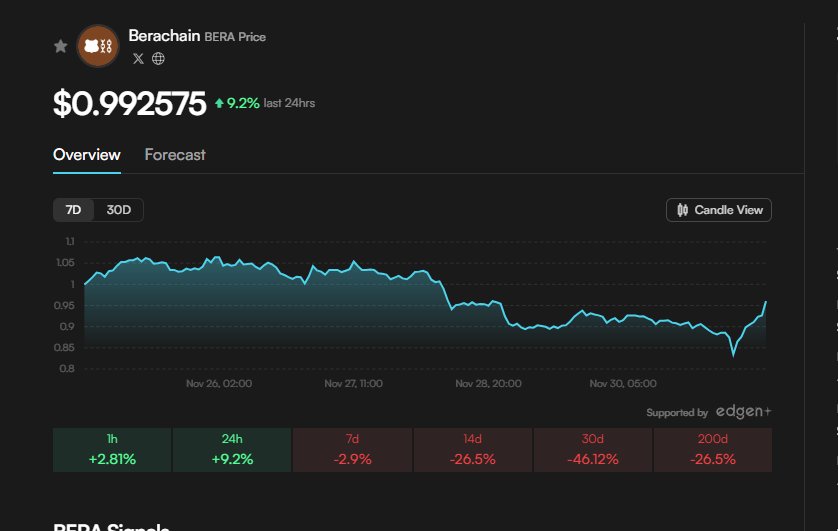
$BERA is posting a strong intraday rebound with a 9.2 percent gain in the last 24 hours, marking the first decisive green day after an extended multi-week downtrend. The bounce formed directly from the 0.86–0.88 zone, an area that has acted as natural demand twice this week, signaling buyers finally defending a key structural level.

Zooming out, the broader picture remains heavily corrective: -2.9% over 7 days, -26.5% over 14 days, -46.12% over 30 days, and -26.5% across 200 days. These multi-window drawdowns reflect persistent derisking and sustained supply pressure. When higher-timeframe windows stay deep red but the 24-hour window prints a sharp green reversal, it often indicates the first signs of short-term accumulation forming at the lows.

The chart shows sellers driving a slow, controlled bleed from the 1.05 region down toward the mid-0.80s without triggering capitulation. Volatility compressed and price drifted into a tightening range — a textbook sign of sell-side exhaustion. Today’s sharp pivot back toward the 0.99 area suggests buyers stepped in with conviction rather than reactionary scalping.

Structurally, the rebound is clean: a fresh higher low off the bottom, a clear reclaim of intraday micro-resistances, and a momentum shift visible in stronger upward candles. These conditions typically form early in recovery structures after prolonged declines.

My view: $BERA is entering an early stabilization phase after a heavy 30-day drawdown. The strong daily performance signals fading downside momentum, and if price can maintain support above the reclaimed 0.92–0.95 region while continuing to print higher lows, a broader recovery setup may begin to develop. Long-term pressure remains dominant, but short-term sentiment has improved meaningfully.

$BERA
Supported by @EdgenTech

view 0
view 0
view 82
2025-12-01 18:42
Tendencia de ART tras el lanzamiento
Bajista
ART shows structural weakness and is bearish in the long run; BERA experiences a strong short-term rebound but remains in a corrective trend over the long term.
Detalles

Predicción de precios

¿Cuándo es un buen momento para comprar ART? ¿Debería comprar o vender ART ahora?

Al decidir si es un buen momento para comprar o vender LiveArt (ART), es importante ajustarse primero a su propia estrategia de trading y perfil de riesgo. Los inversores a largo plazo y los traders a corto plazo suelen interpretar las condiciones del mercado de forma diferente, por lo que su decisión debe reflejar su enfoque personal. Según el último análisis técnico de 4 horas de ART, la señal de trading actual es Hold. Según el último análisis técnico de 1 día de ART, la señal actual es Hold.
60
Hold
Análisis técnico de 4 horas de ART
Última actualización 2026-06-10 15:59:59
44
Hold
Análisis técnico de 1 día de ART
Última actualización 2026-06-09 23:59:59
beacon

Predicción de Beacon

Pronóstico probabilístico de precios (próximas 24 horas)
i
Descargo de responsabilidad de la predicción de Beacon
Los resultados de los datos que se muestran en esta página se analizan en función de los datos de trading reales (OHLCV) del par de trading seleccionado junto con los indicadores técnicos correspondientes.
Esta predicción es un producto técnico experimental y se proporciona solo con fines de referencia. No constituye un consejo de inversión. Los acontecimientos inesperados del mundo real pueden influir significativamente en el comportamiento del mercado. Por tanto, los traders deben tomar decisiones con precaución.
Sobre LiveArt
LiveArt (ART) is a cryptocurrency launched in 2025and operates on the Base platform. LiveArt has a current supply of 996,604,330.245923 with 432,795,846.4235806 in circulation. The last known price of LiveArt is 0.00033853 USD and is up 2.63 over the last 24 hours. It is currently trading on 24 active market(s) with $290,465.12 traded over the last 24 hours. More information can be found at https://liveart.io/.
Leer más