Celestia (TIA)

$0.3636  -3.55%  24H

Social Sentiment Index (SSI)

Market Pulse Ranking (MPR)

X Posts

  • chief of overthinking TA_Analyst Trader A
     1.74K  @brilliantpanicc

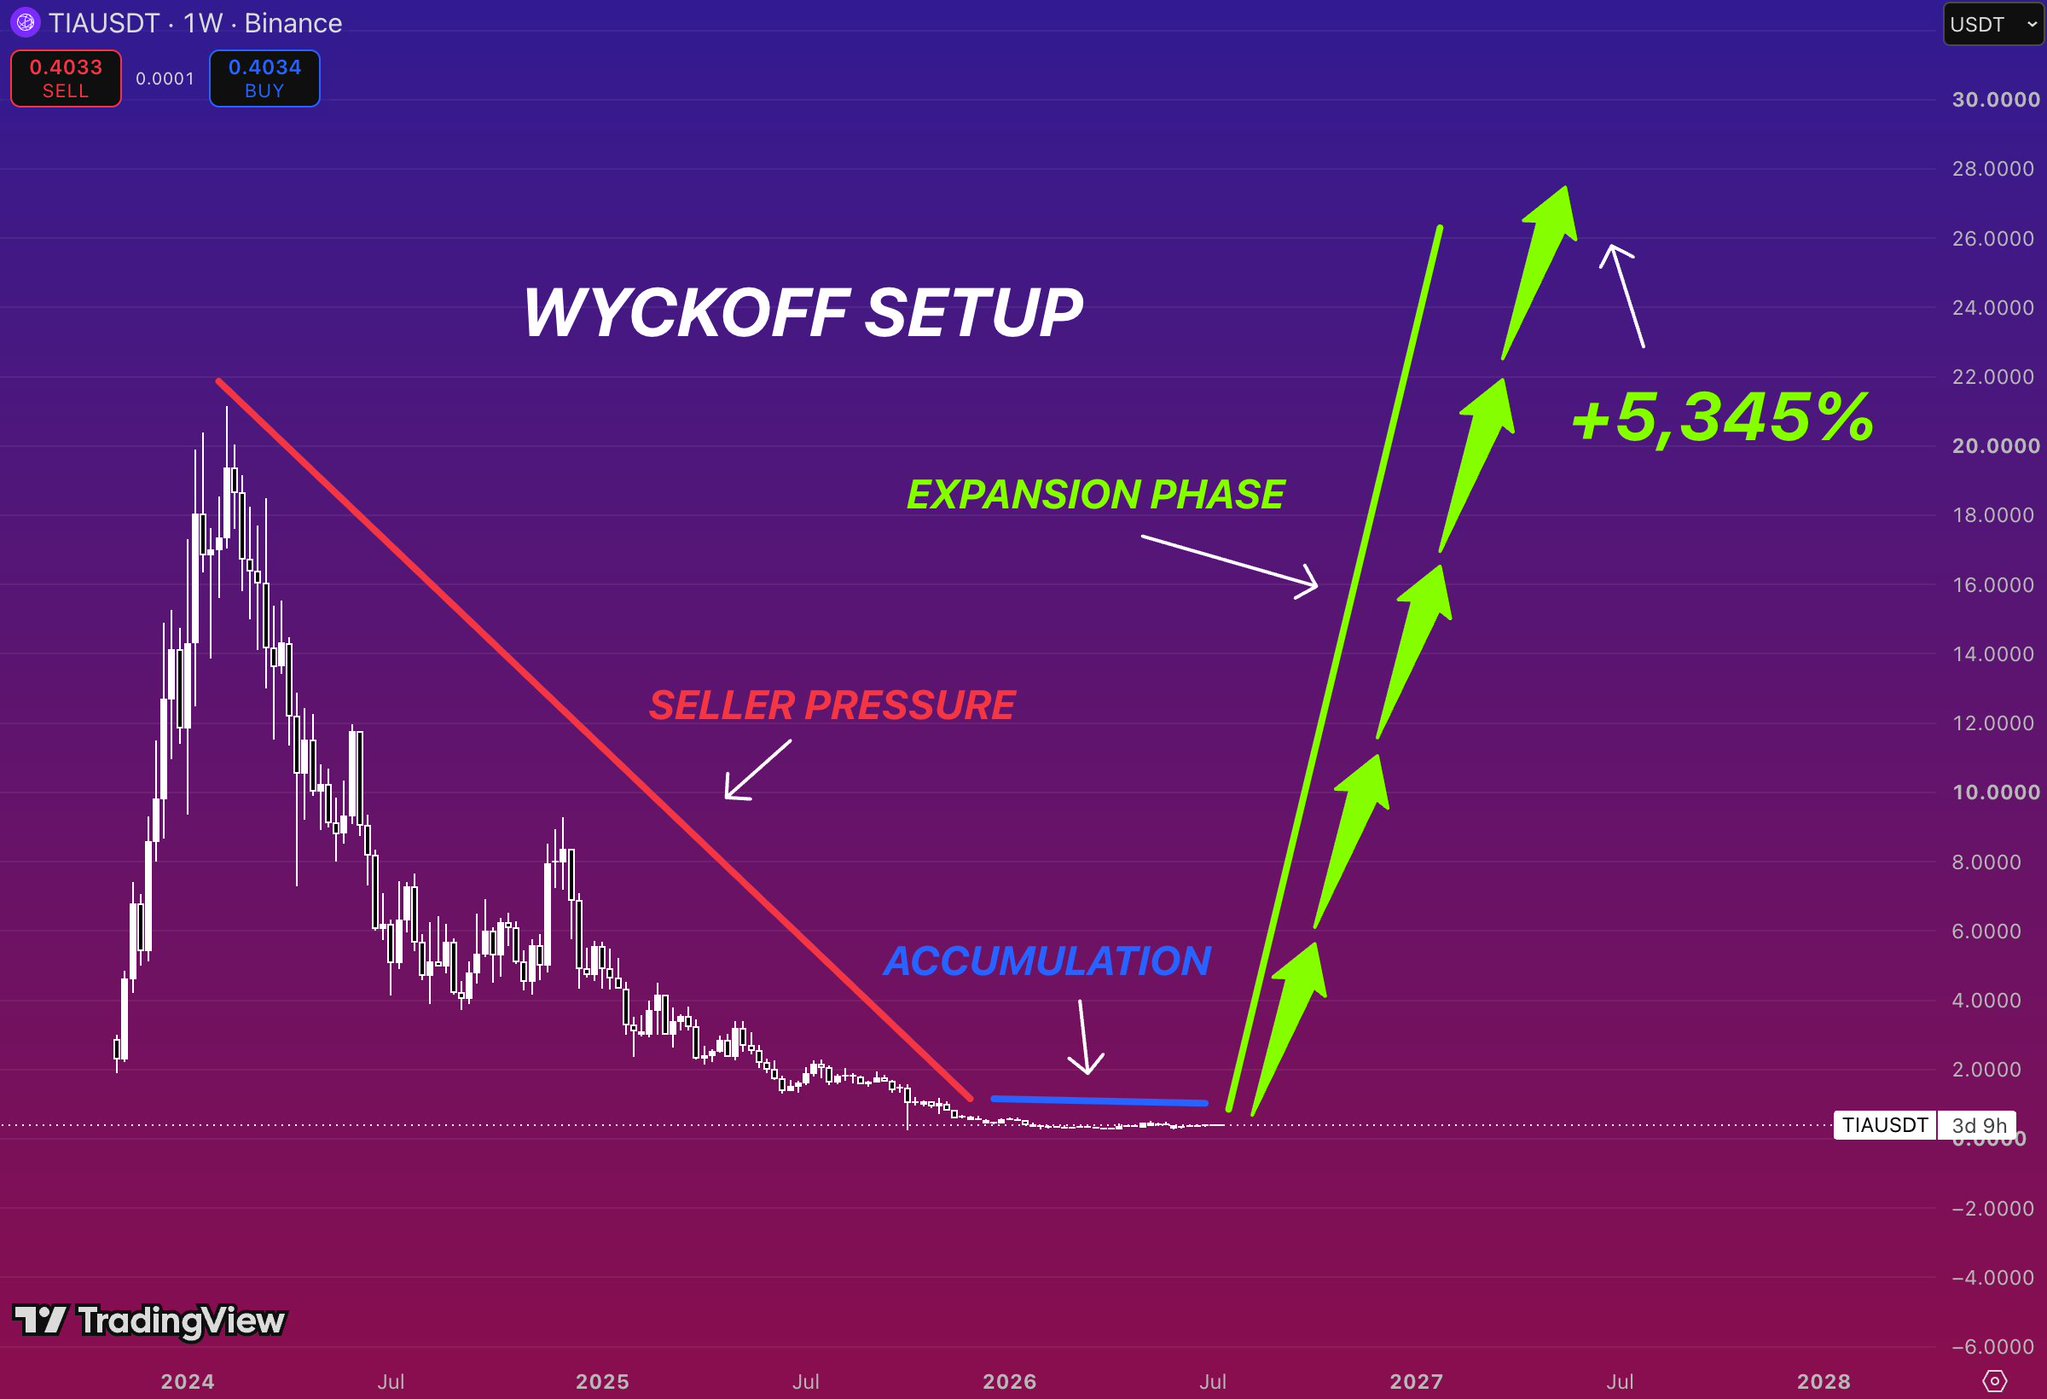
    $TIA IS BUILDING A CLASSIC WYCKOFF ACCUMULATION. For months, $TIA has been under constant seller pressure. Every rally was met with aggressive selling. That created a prolonged downtrend. But recently, something changed. Price stopped making meaningful new lows. Volatility collapsed. Selling pressure faded. Instead of trending lower… $TIA started moving sideways. That’s often how accumulation begins. Smart money accumulates while retail loses interest. These phases usually feel boring. That’s exactly why most people ignore them. But the biggest trends often start from periods like this. Once accumulation is complete, expansion can happen very quickly. The chart points to a potential move of more than 5,300% from current levels. Accumulation first. Expansion second. That’s the Wyckoff cycle in its simplest form. $TIA may be approaching the point where that expansion phase begins

     2  0  147
    Original >
    Trend of TIA after release
     Extremely Bullish
    TIA is in a Wyckoff accumulation phase, expected to experience an explosive rise of over 5,300%.
  • rakuda.perps Derivatives_Expert Trader A
     5.95K  @rakuda_account

    TIA seems to still have plenty of stamina w

    Celestia D
     370.19K  @celestia

    Today we are proud to announce that Celestia Labs has acquired Sovereign Labs. This acquisition establishes Celestia Labs as a full-stack custom blockchain development partner for companies building onchain, marking a new chapter for our go-to-market strategy and ambitions. https://t.co/NQFYcyDMvu

     1  0  1.57K
    Original >
    Trend of TIA after release
     Bullish
    Celestia Labs acquires Sovereign Labs, enhancing its full-stack blockchain development capabilities
  • ⚜️BAŞKAN TEKNİK~KRİPTO⚜️ TA_Analyst Educator S
     6.46K  @BaskanTeknik_K

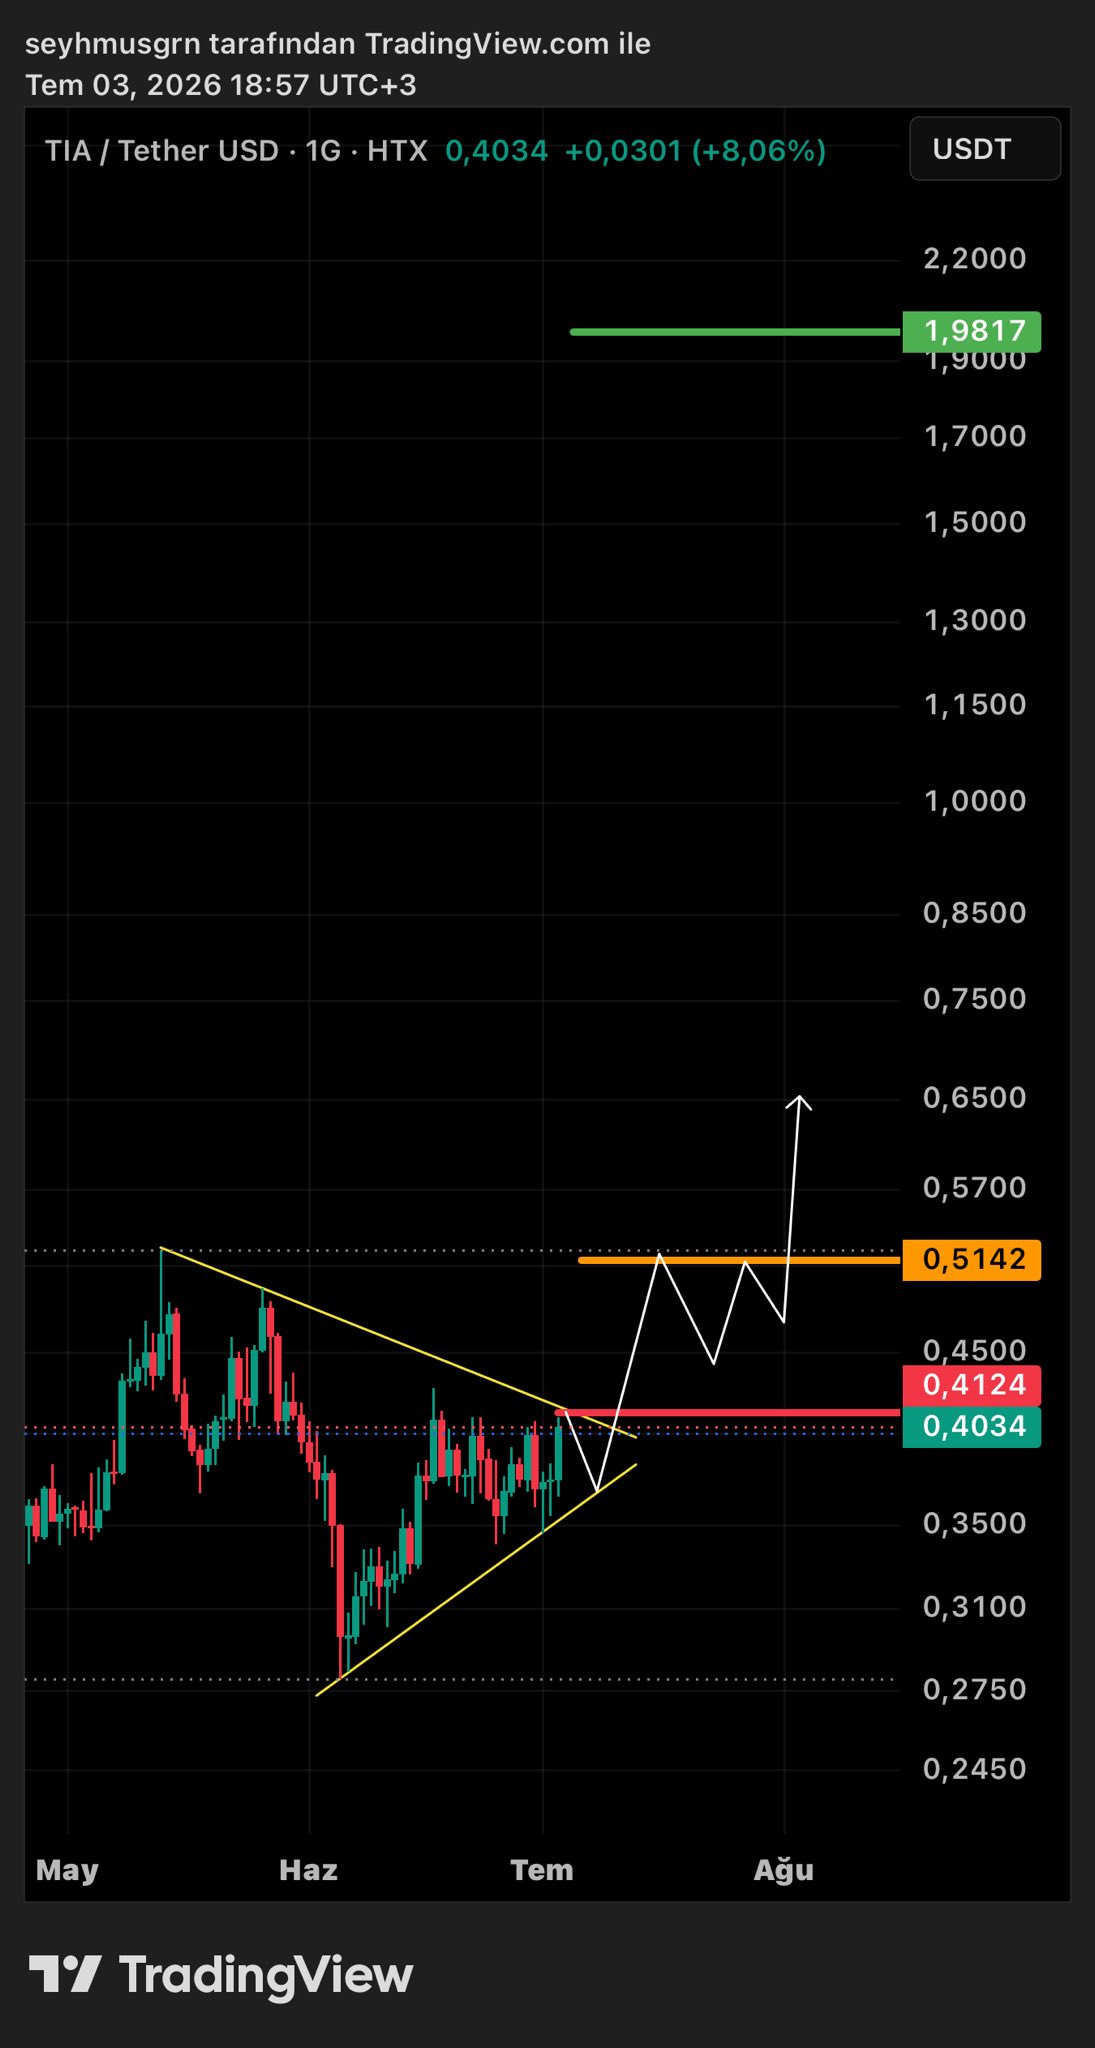
    $TIA | latest view! We will look for persistence above $41! It is beneficial to have a short stop below $40!✍🏻(ytd) https://t.co/nBAmoB6u04

    ⚜️BAŞKAN TEKNİK~KRİPTO⚜️ TA_Analyst Educator S
     6.46K  @BaskanTeknik_K

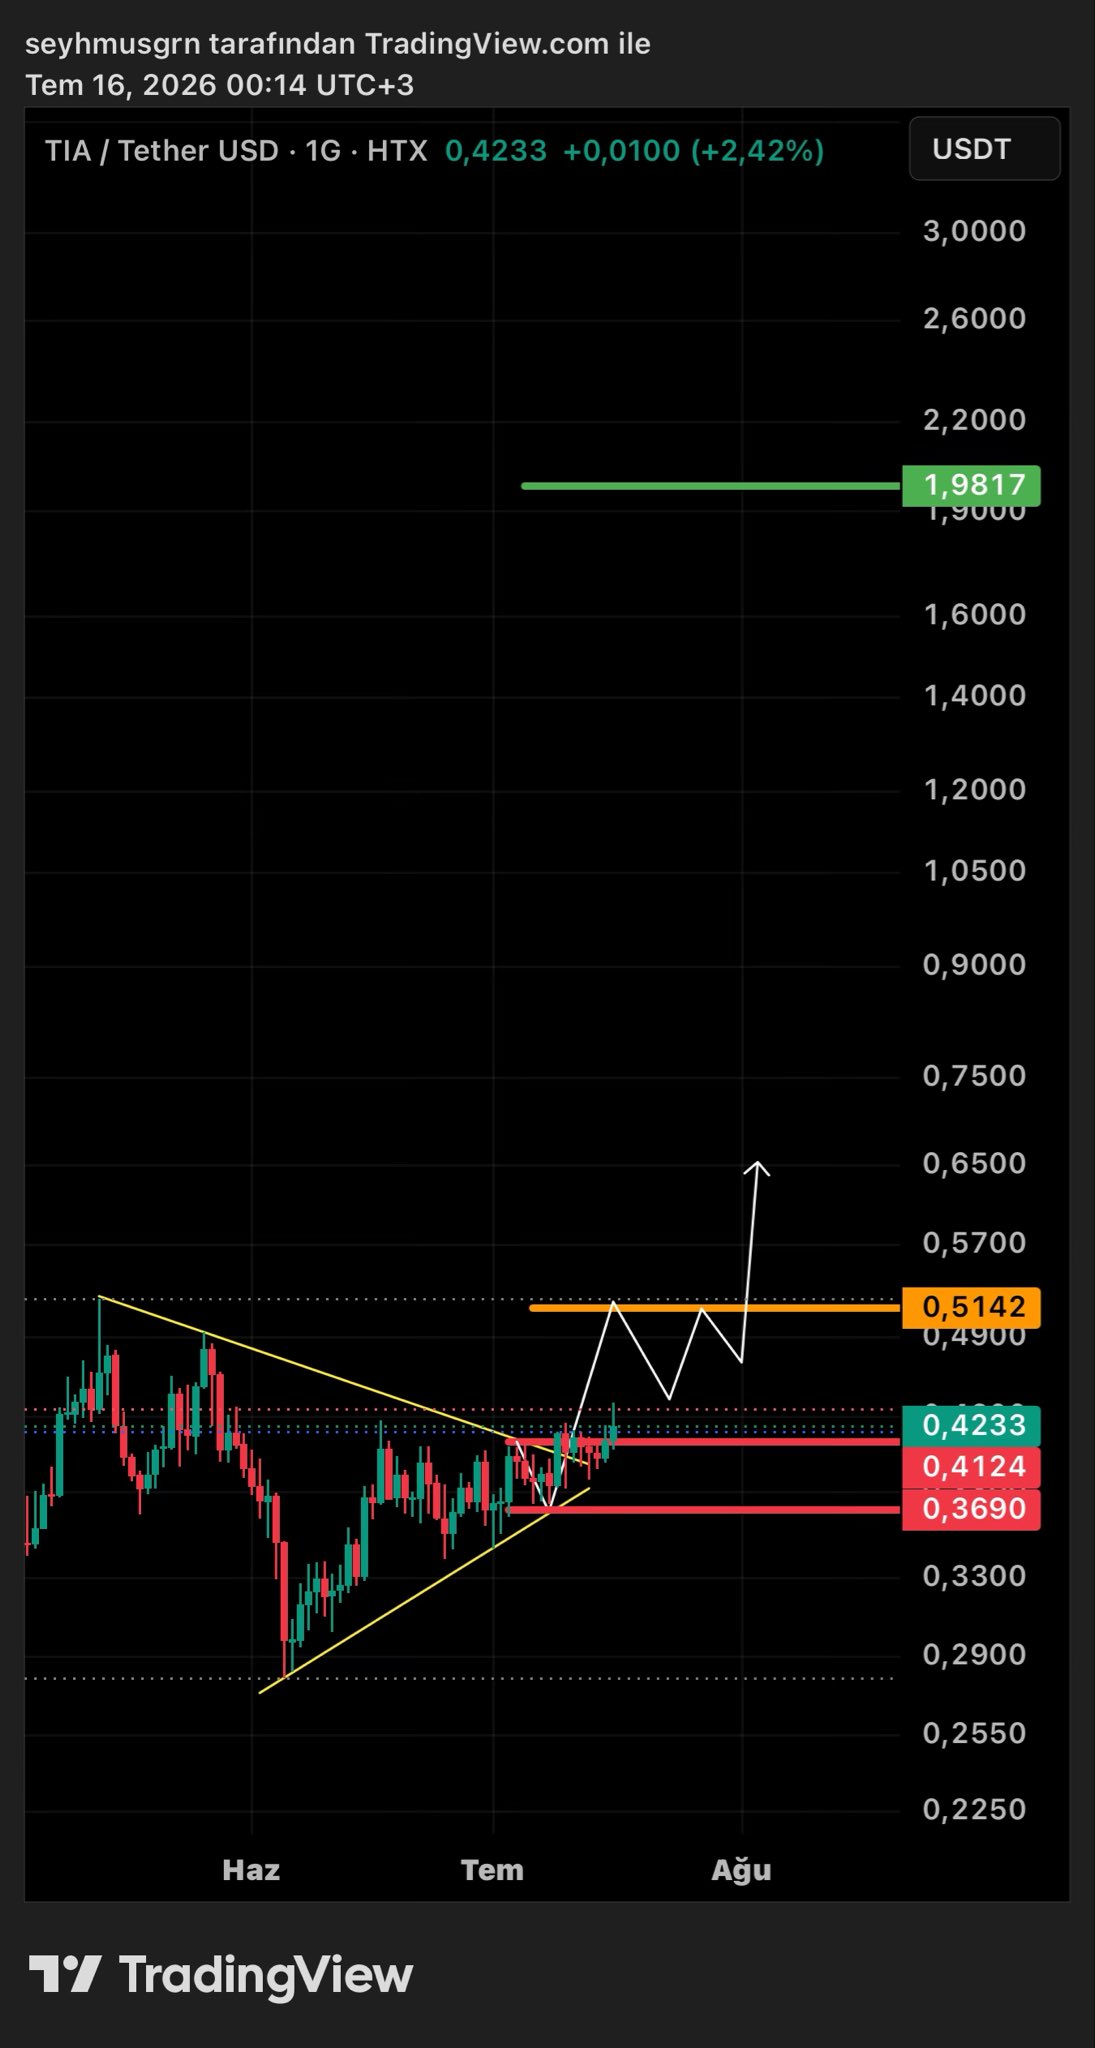
    $TIA #TIA #tia | follow the white lines!✍🏻(ytd) https://t.co/AyKJJkMaFa

     45  3  9.40K
    Original >
    Trend of TIA after release
     Bullish
    TIA is expected to rise after breaking the descending triangle, with a target price near $2.
  • Can Özsüer TA_Analyst Trader C
     100.12K  @canozsuer

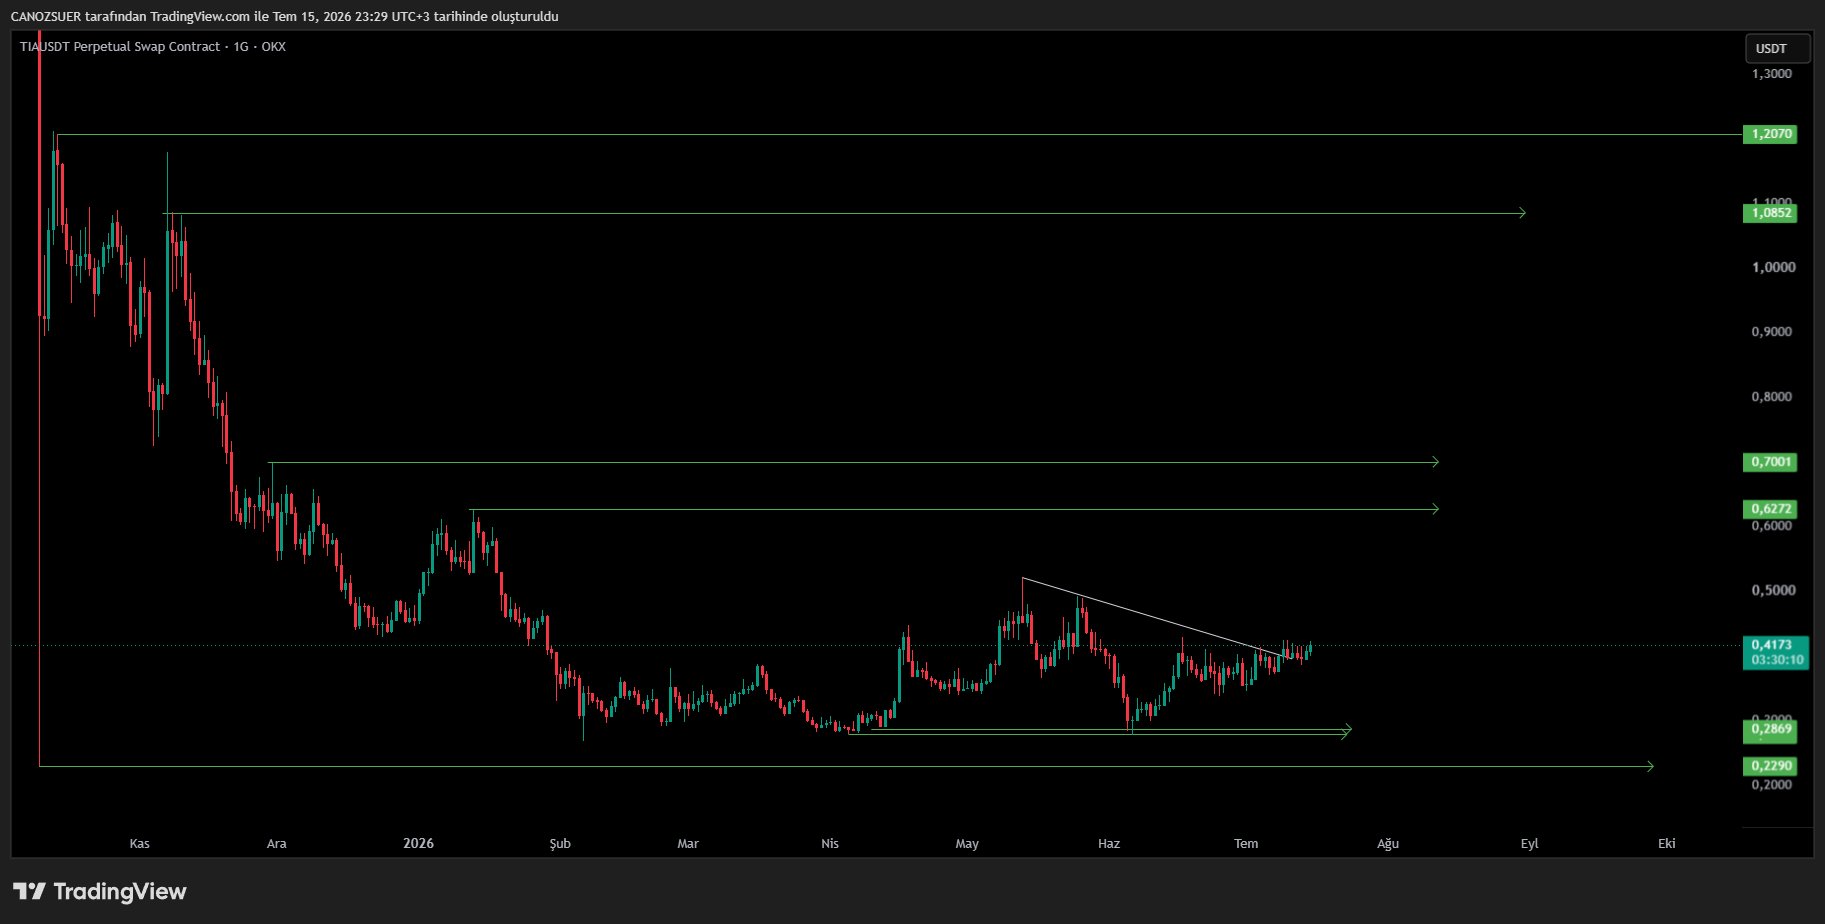
    celestia:native #TIAUSDT Instant price $0.4175 I like its daily chart. The 7‑month consolidation process is about to finish. Now is the time to slowly release the accumulated energy. This doesn’t look like something that will end with just a 5‑10% rise. I won’t meddle with what you do on the futures side, but I’d say don’t rush to sell immediately on the spot side. I’m carrying around $0.35 on spot, and I have a tiny position on futures, waiting to add if it drops. Post daily‑chart style ones in the comments and let’s analyze together.

     44  4  6.02K
    Original >
    Trend of TIA after release
     Extremely Bullish
    TIA ends a 7‑month consolidation, expected to surge sharply, recommended to hold and add on dips.
  • chief of overthinking TA_Analyst Trader A
     1.74K  @brilliantpanicc

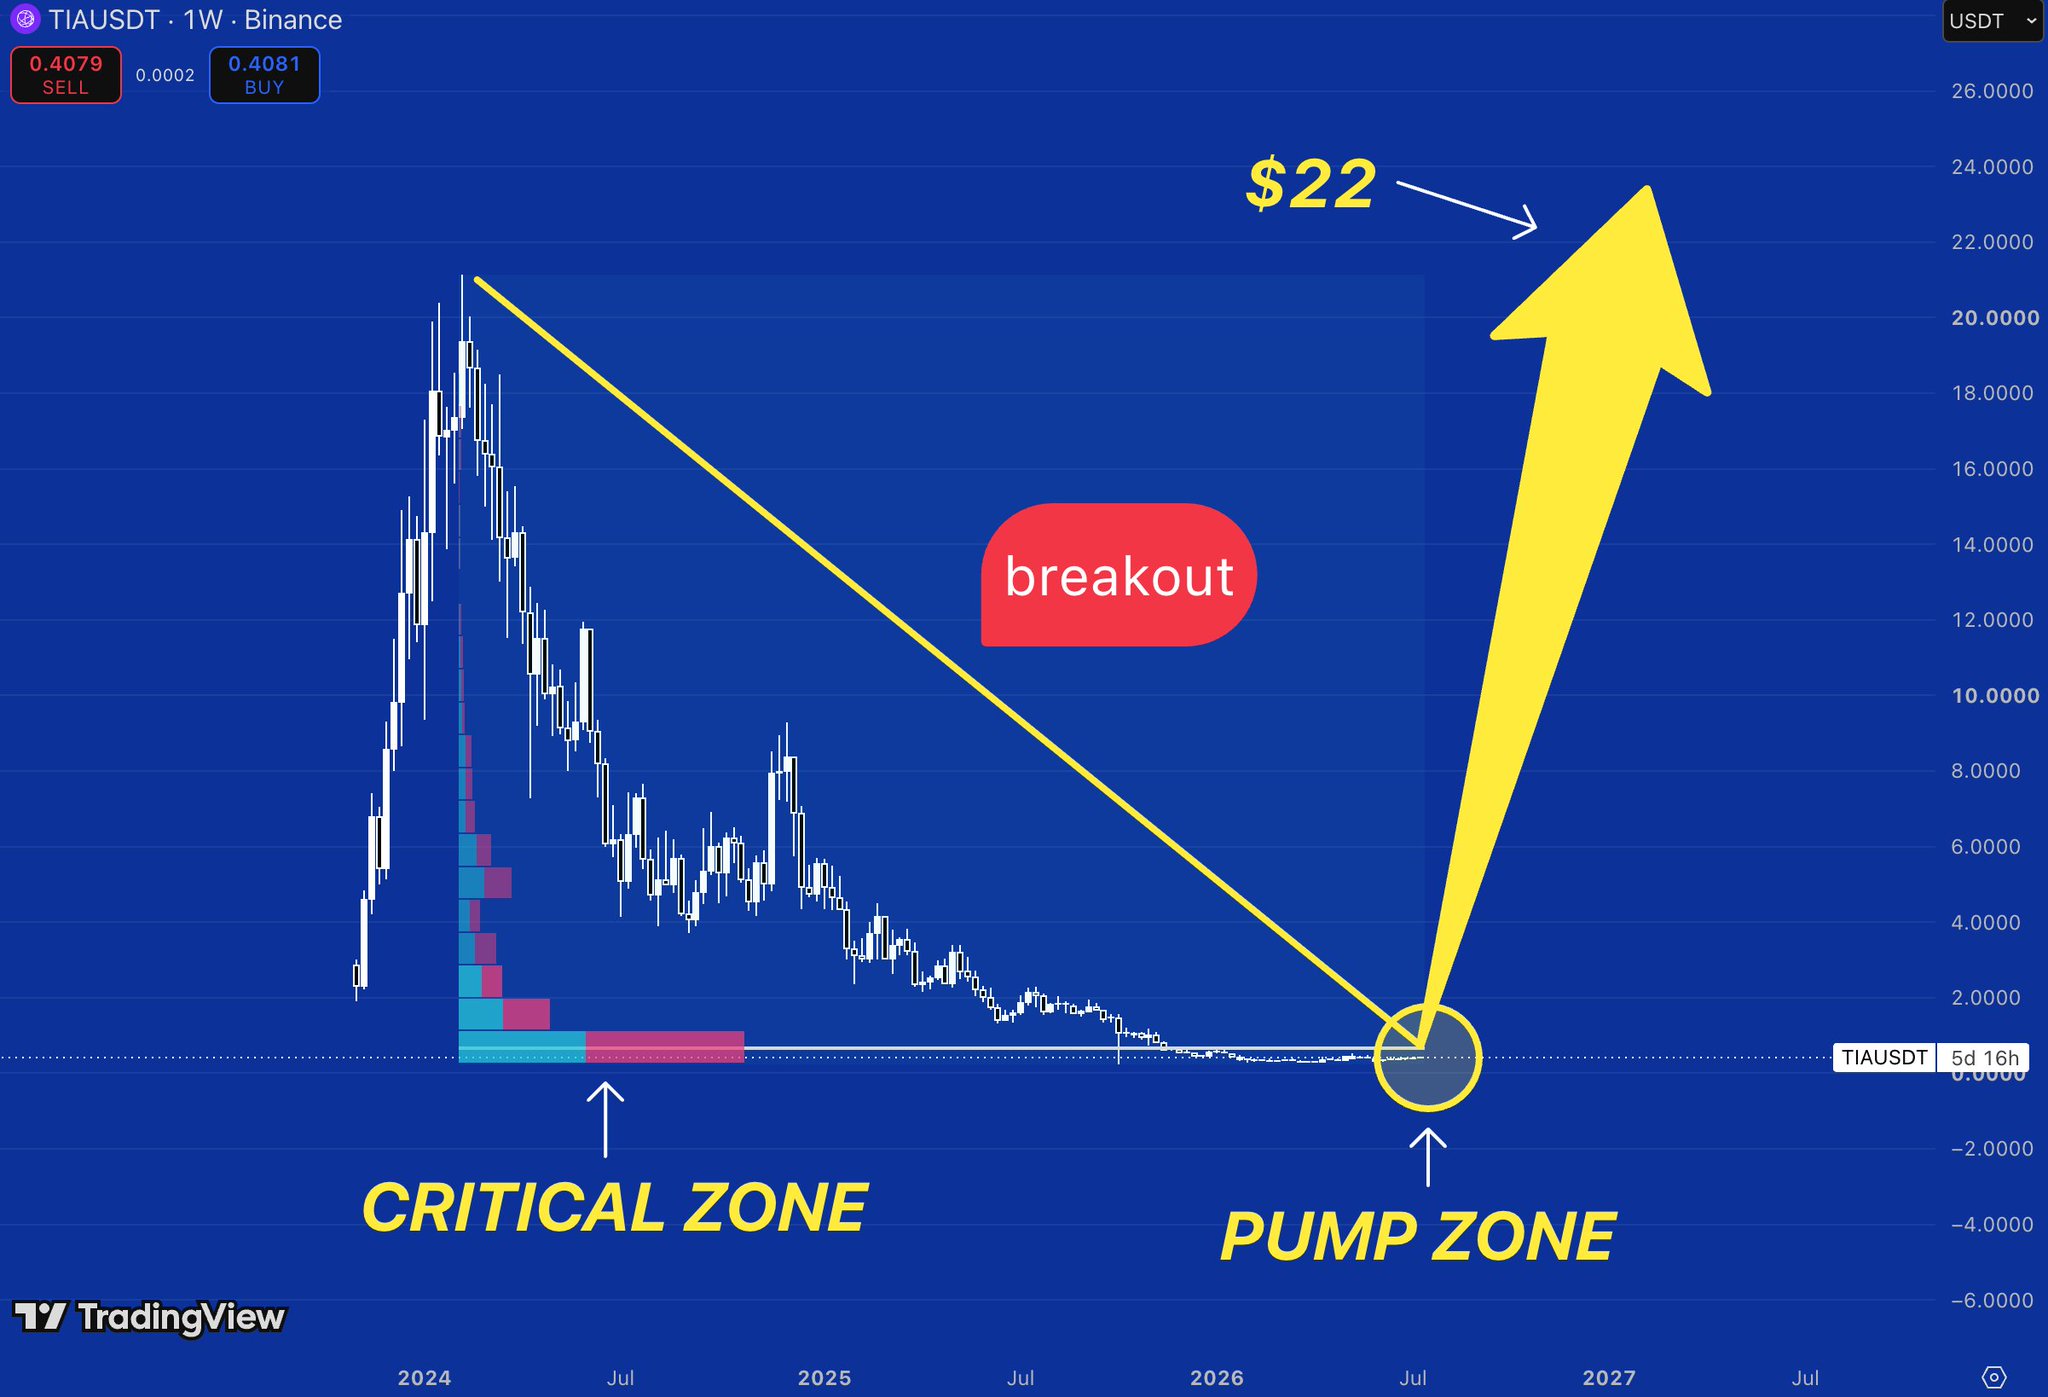
    $TIA is sitting in the most important zone on the chart. This is where trends are born. After losing more than 98% from its peak price has returned to a major accumulation area. The volume profile also shows that this is where the largest amount of trading took place. That makes this level difficult to ignore. As long as buyers defend it, the downside becomes more limited. The next thing to watch is the descending trendline. A breakout above it would signal that long-term momentum is finally shifting. That’s when sidelined buyers usually begin to return. If the breakout is confirmed, the first major objective sits around $22. That would represent an enormous move from current prices. The longer an asset spends building a base… The stronger the breakout can become. 🚀

     9  0  572
    Original >
    Trend of TIA after release
     Extremely Bullish
    TIA is in a critical accumulation zone; a breakout above the descending trendline targets $22 and signals a massive upside.
  • Para Mühendisi D
     82.91K  @paramuhendisim

    He was changing the world, with amazing technology. The crypto market needs a serious cleanup. Otherwise there is no bull run. We will only watch the BTC bull. https://t.co/69ZVt3dIoz

     73  35  17.06K
    Original >
    Trend of TIA after release
     Extremely Bearish
    The crypto market needs a thorough overhaul, the TIA price crash is an example of market failure, only BTC might have a bull market.
  • Kriptotiks👁‍🗨 TA_Analyst Trader C
     10.29K  @cryptotiks

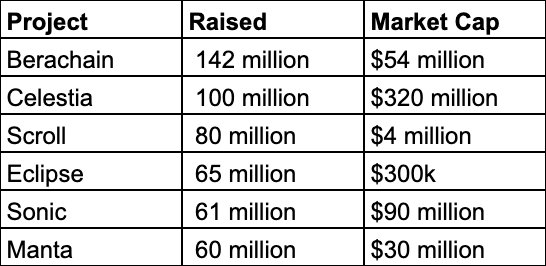
    If we see a possible crash/strong correction, what should we buy? What should we focus on? The buying opportunity is the same as the discussion I mentioned in the article I wrote before: price or perception. Something approved by data and perception is a buying opportunity, friends. In a possible confirmed buying opportunity (whether you call it a crash or a dip makes no difference), the first thing we will do is manage our cash on the side well. Yesterday I talked about my own management, I keep at least 40% cash no matter what. Then we look at the projects' technical trends before the decline (were they stronger compared to others) Project's code architecture and foundation, github developer activities Tokenomics, Mcap/FDV ratio These are the things to look at at the first stage. The reason is: if there is a vulnerability, you will have problems being hacked in its architecture. So focusing on those that have not experienced a serious hack so far is a bit more logical. The Mcap/FDV ratio is also a point you should look at to protect yourself from inflation. For example, despite TIA dropping 90% from its peak, seed investors still have a profit of more than 15x. Even if a crash comes, those people sell the assets at profit without hesitation. Therefore, you need to ensure the Mcap/FDV ratio is as closed as possible. After meeting these, you need to do sector analysis. RWA DeFi (Stablecoin yield, borrowing-lending) Perp DEX/Spot DEX AI and AI agent GPU, DePin These are the main sectors we all know. By filtering projects that meet the initial criteria among these sectors, you will already obtain a list of projects that can be considered solid. In those projects, the first point to pay attention to is that supply control should be as evenly distributed as possible, or the team should be holding tokens for a purpose. Second, does the project make money? If it does, what does it earn from? Does it distribute its earnings? If it does all these, congratulations, you have found the most solid project you can find. Now, is there a guarantee that the most solid project will rise? No, that's where crypto gets challenging. Even giants like LINK can stay flat while a project like BANANAS31 can rise. A solid project = not guaranteed profit or rise. Therefore, when allocating your portfolio, my advice is to keep some cash at a certain level and split the altcoin balances you allocate into Solid projects and Risky, shit, meme projects. A part of the amount you invest should be in solid projects, the other part you should chase high risk so you don't miss out on asymmetric returns. My personal view is that in the future projects working on RWA and DeFi (especially lending, collateralization, borrowing) will be in the "solid" category. I have given examples in my previous articles. These are my own ideas, friends, not any investment advice etc.

     22  3  1.16K
    Original >
    Trend of TIA after release
     Neutral
    Choose RWA/DeFi projects with good fundamentals and strong Tokenomics during a crash.
  • MiCryptoMundo 🏊🛡️ Trader TA_Analyst C
     11.87K  @MiCryptoMundo

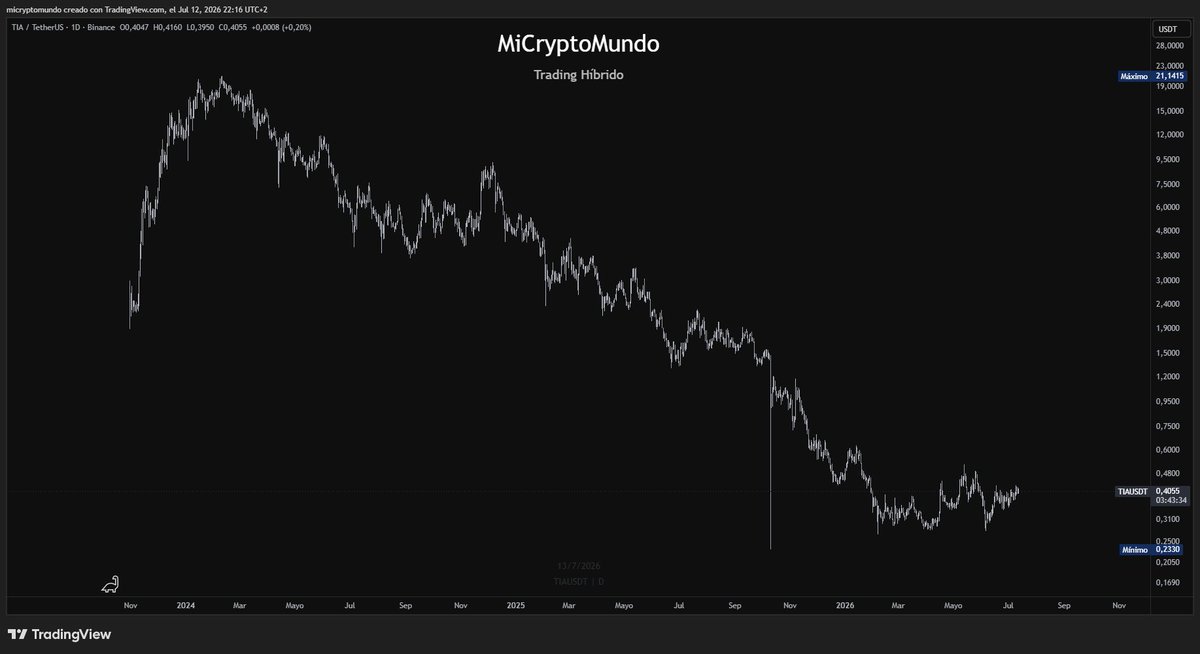
    Staking $TIA was considered an opportunity. Those were the times. https://t.co/pRuij7KSfg

     5  0  856
    Original >
    Trend of TIA after release
     Extremely Bearish
    TIA fell from its peak of $21 to $0.4, and the author laments that the once-staking opportunity is gone.
  • logical TA_Analyst Trader A
     1.38K  @0xLogicalx

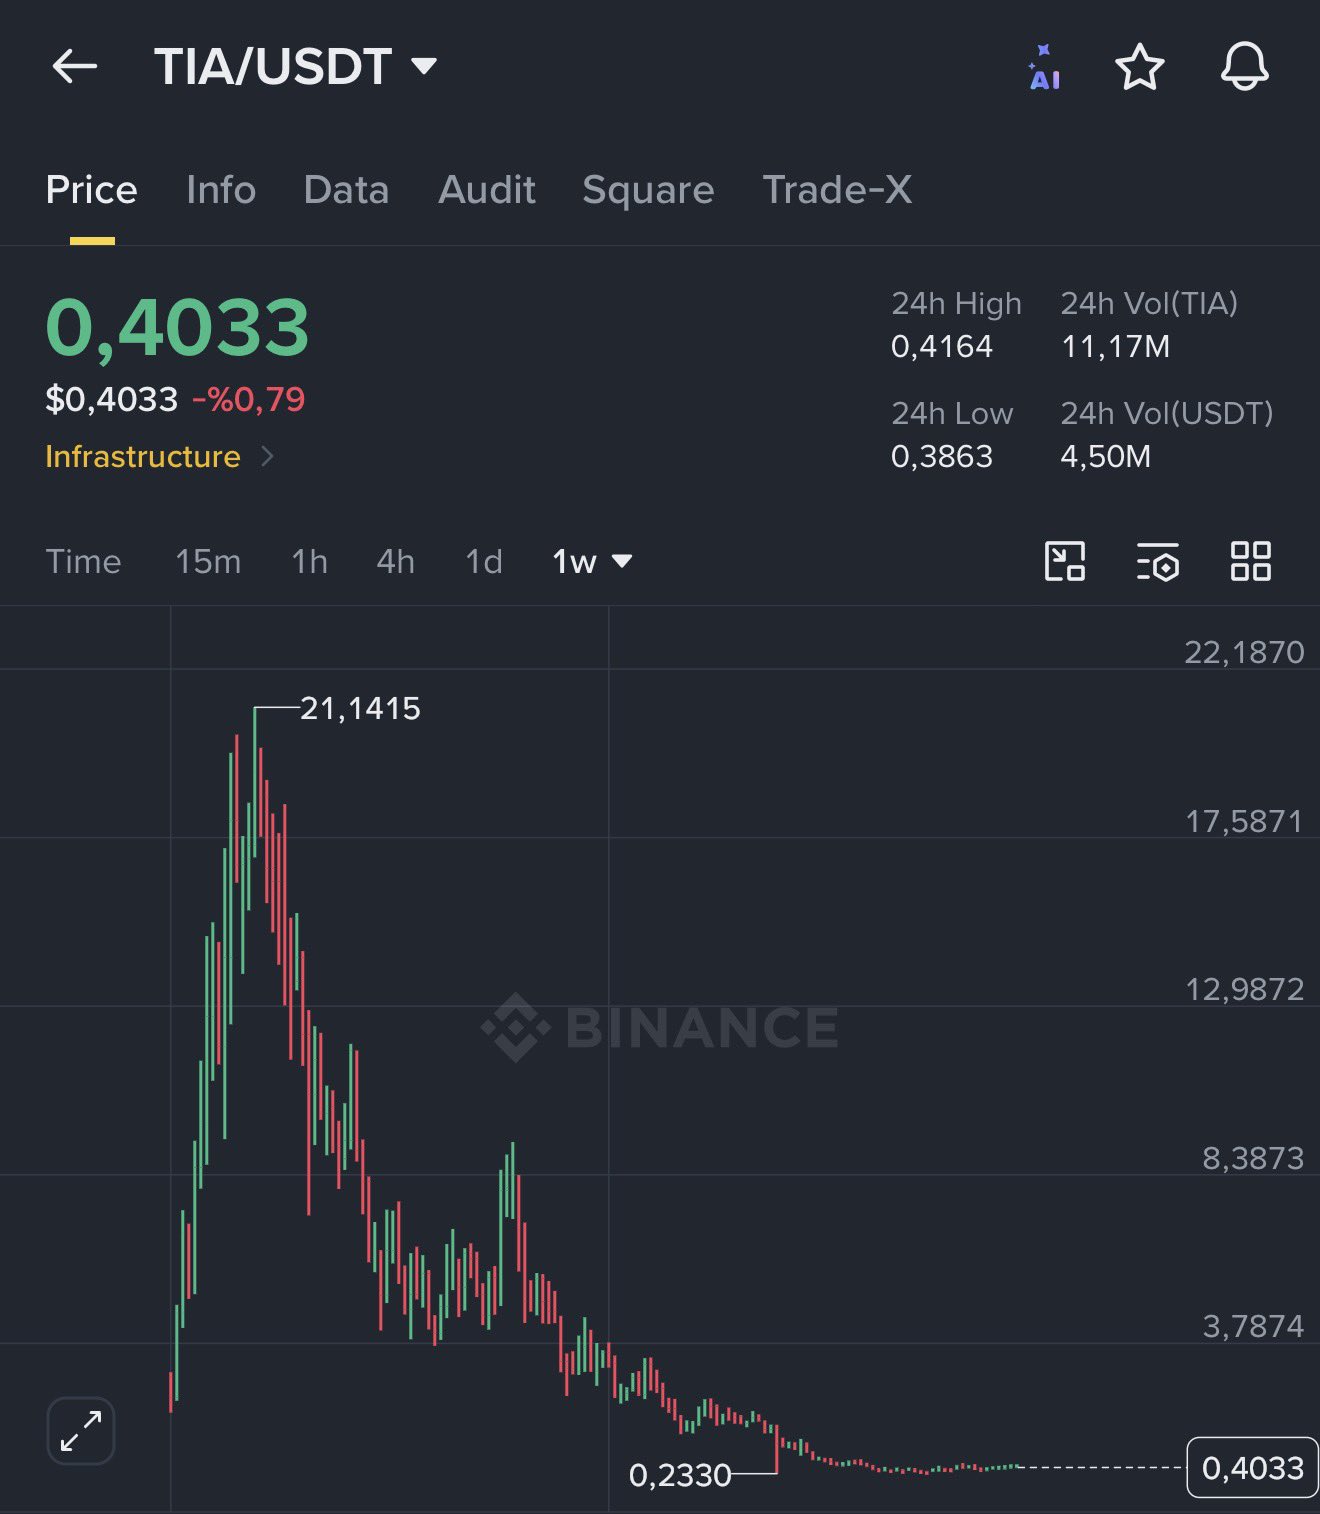
    Everyone is waiting for new highs. But very few notice where they actually begin. Not at the top. At the bottom. $TIA has spent months building a base after losing more than 95% from its peak. This is the same phase where previous cycles quietly reversed. The market looks dead. That’s usually when the biggest opportunities appear. The first target sits around $9. Then comes the major resistance near $12. If momentum continues, the chart opens the door back toward $21+. That’s where the previous cycle topped out. Every bull market has coins that surprise everyone. $TIA could become one of them. 🚀

     15  0  734
    Original >
    Trend of TIA after release
     Extremely Bullish
    TIA has built a bottom from the low, expected to reverse and target above $9, $12 and $21.
  • Can Özsüer TA_Analyst Trader C
     100.12K  @canozsuer
    Can Özsüer TA_Analyst Trader C
     100.12K  @canozsuer

    $TIA #TIAUSDT | 18H I like the structure forming on the daily chart. Even though the short‑term first target is around $0.62, my focus is on the liquidity of that wick that initiated the whole decline. After the $0.62 target, we need to consider the possibility of a parabolic move towards $1.20. The weekly chart shows much higher targets, but in the short‑to‑mid term we could see a rally up to $1.20.

     59  3  7.24K
    Original >
    Trend of TIA after release
     Extremely Bullish
    TIA daily chart structure looks bullish, short-term target $0.62, mid-term target $1.20.