Rewards
Futures Daily Draw
100% Chance To Win With Daily Trades
Spot Daily Draw
Win 8,888 USDT In Grand Prizes
Mobile Top-Up
Top up mobiles easily, online, secure
Send
Send money globally, fast and secure
BitMart Mall
Live on crypto

RAI Finance (SOFI)
$ 0.000049 (SOFI/USD)
0.00%
24H
RAI Finance Live Price data
Today's price of RAI Finance Is $ 0.000049 (SOFI/USD). With A Market Cap Of $ 29,874.37 USD. 24-Hour Trading Volume Of $ 0 USD, A 24-Hour Price Change Of +0.00%, And A Circulating Supply Of 598.31M SOFI.
RAI Finance SOFI Price History USD
Track the price of RAI Finance for today, 7 days, 30 days and 90 days
Period
Change
Change (%)
Today
$ 0
0.00%
7days
$ 0.0000099
25.00%
30days
$ 0.000039
400.00%
90days
$ 0.000019
66.67%
Own SOFI Now
Buy and sell SOFI easily and securely on BitMart.
RAI Finance Market Information
$ 0.000049 24h Range $ 0.000049
All time high
$ 0.00010
All time low
$ 0.0000051
24h Change
0.00%
24h Vol
$ 0
Circulating supply
0.59B
SOFI
Market cap
$ 29,874.37
Max supply
--
Fully diluted market cap
$ 49,931.56
Trade SOFI

RAI Finance X Insight

chad.
TA_Analyst
Trader
B
 21.3K @chad_ventures
 Bullish
SOFI faces strong resistance at $19, and a breakout could lead to an upside move.
chad.
TA_Analyst
Trader
B
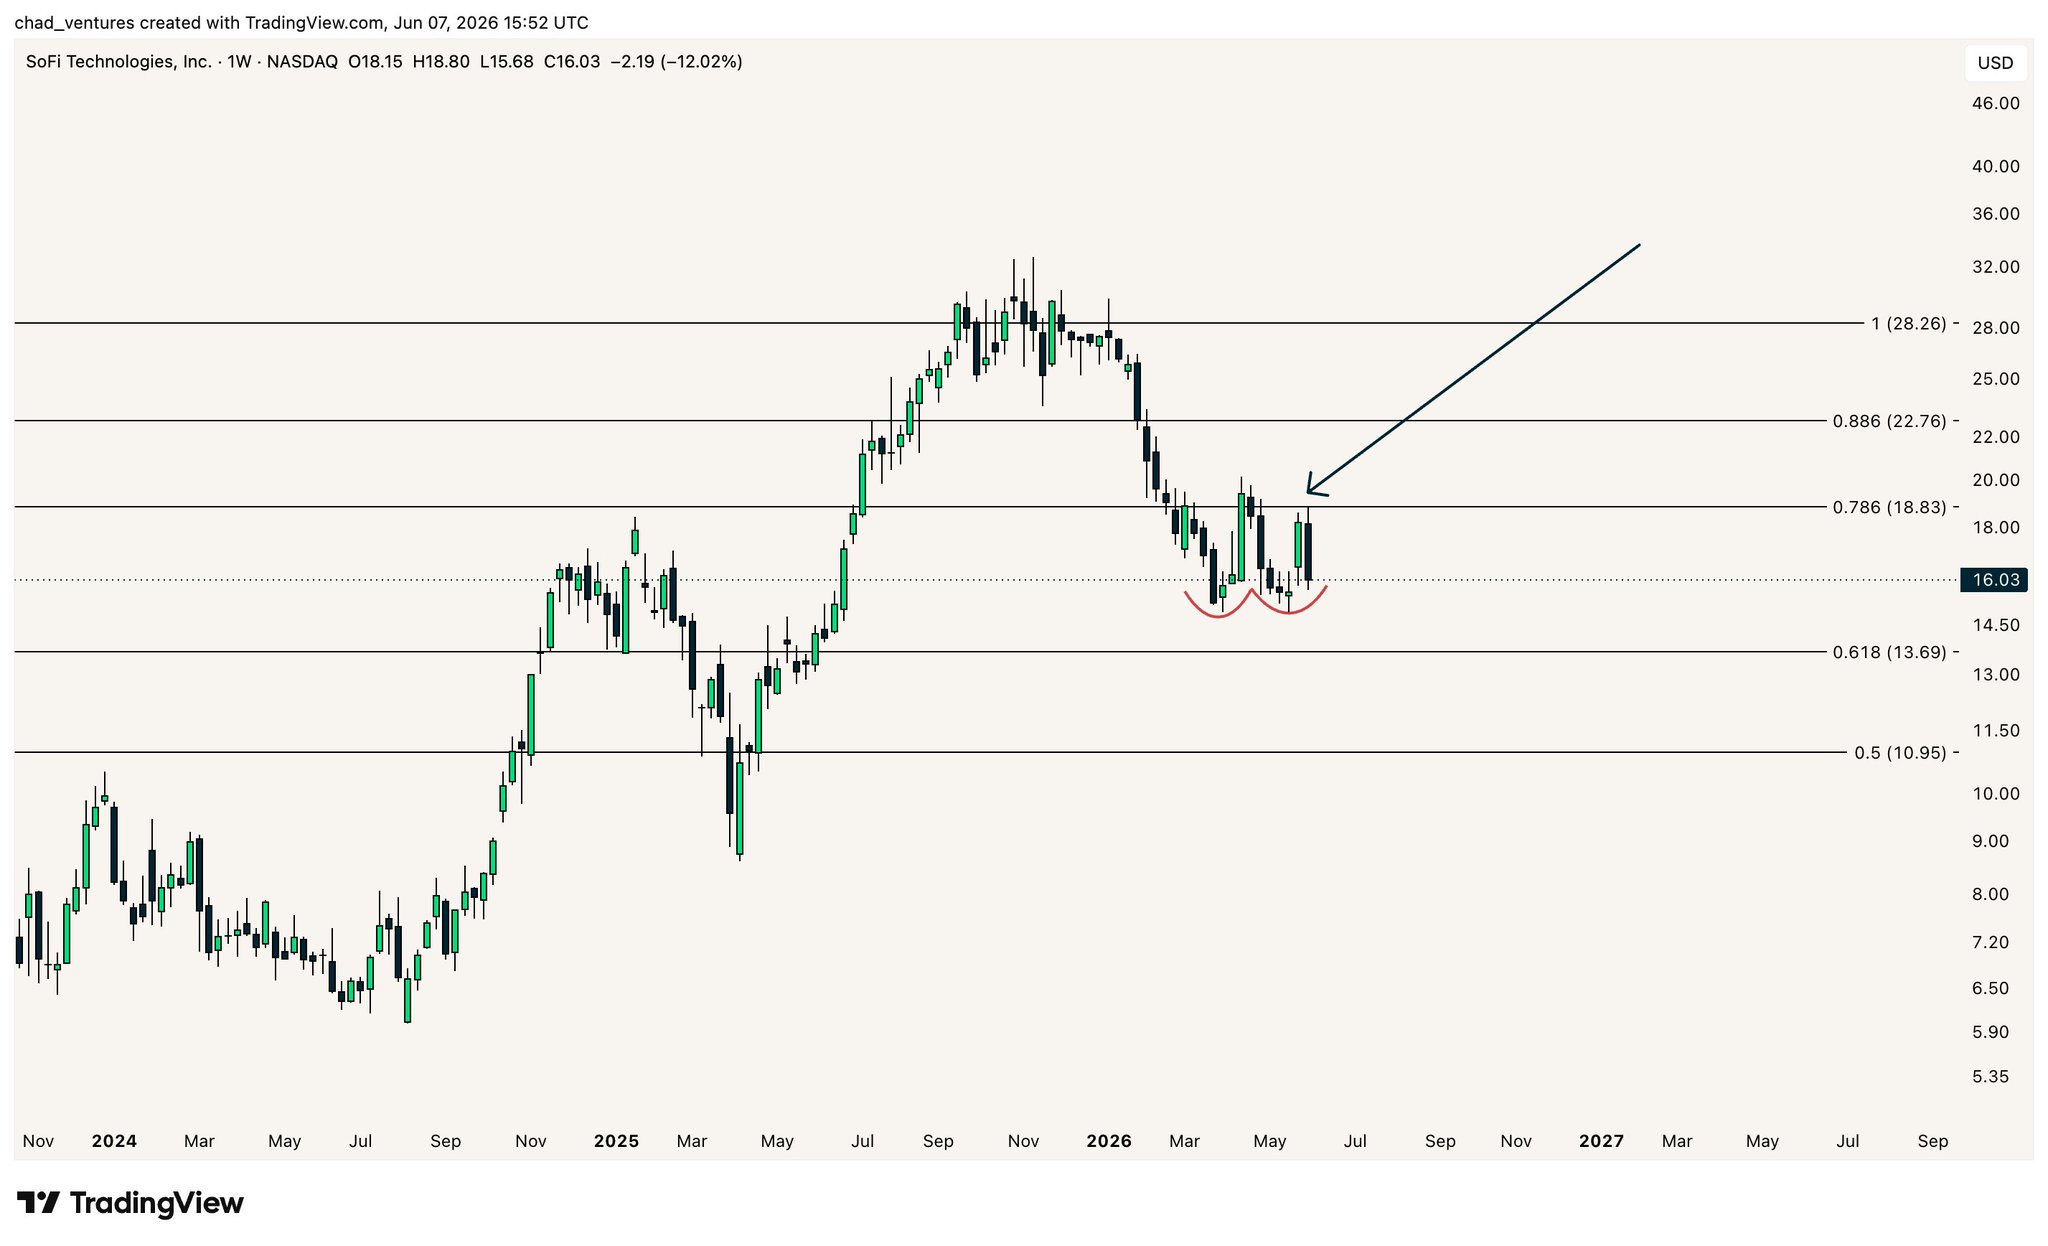
21.3K @chad_ventures $SOFI weekly
One more point of confluence regarding the strong resistance area around $19 is the 0.786 log Fibonacci level
Thus, $19 really is the main level to reclaim for more positive price action to occur again https://t.co/z9Mxk23nB9
 103
103
 4
4
 19.5K
19.5K
2026-06-07 23:17
Trend of SOFI after release
Bullish
SOFI faces strong resistance at $19, and a breakout could lead to an upside move.
chad.
TA_Analyst
Trader
B
21.3K @chad_ventures Bullish
SOFI monthly chart forms a bullish cup‑handle pattern, structure intact, short‑term sentiment is weak.
chad.
TA_Analyst
Trader
B
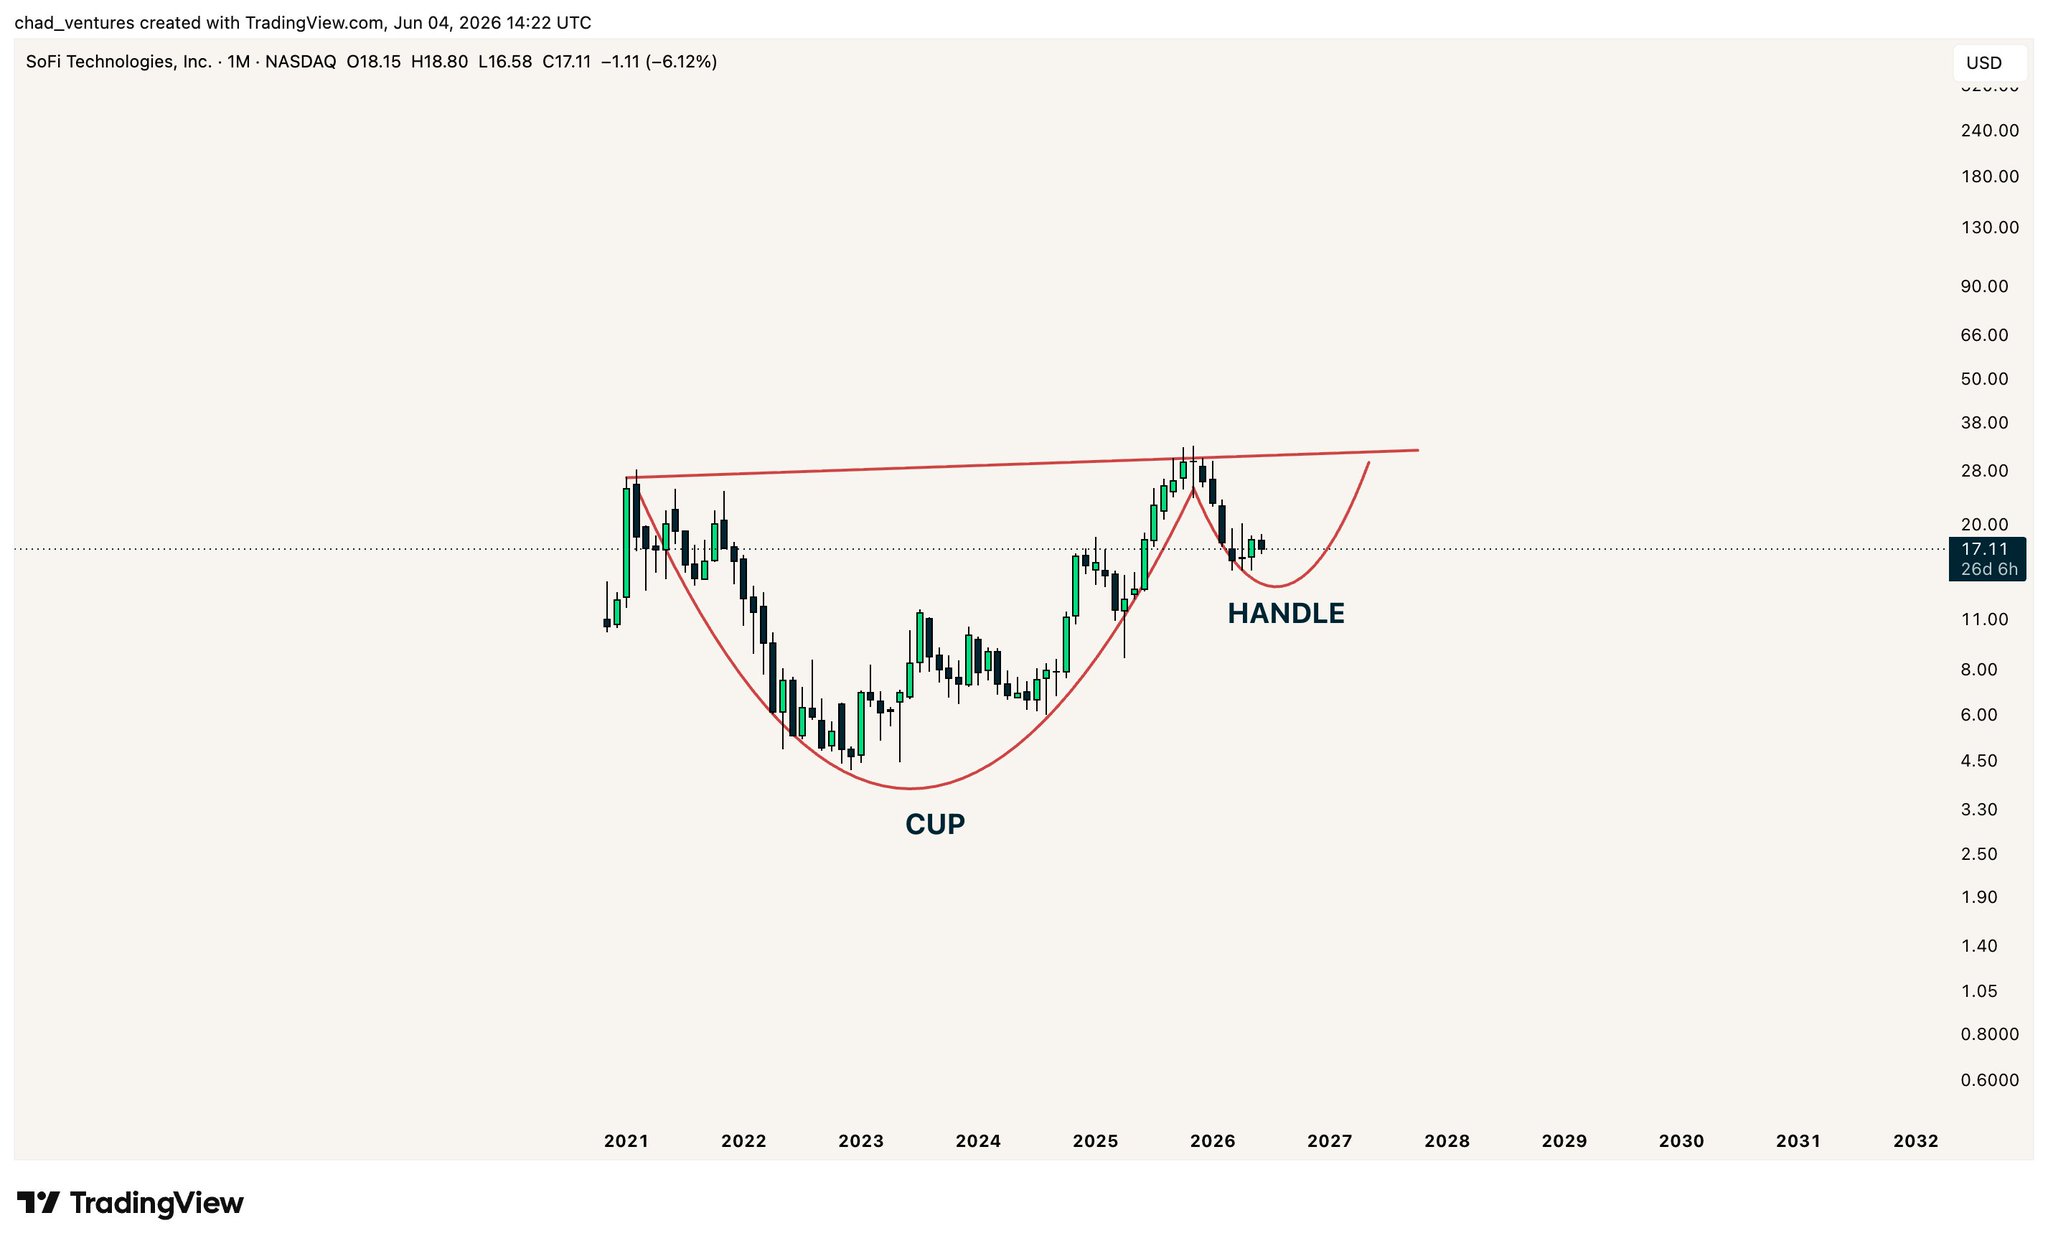
21.3K @chad_ventures $SOFI monthly cup & handle forming
Sentiment is always terrible near the bottom of the handle
All in all, still looks like a HTF higher low so bullish structure is intact, objectively https://t.co/3hq60r0NKU
 192
6
18.7K
192
6
18.7K
2026-06-04 20:37
Trend of SOFI after release
Bullish
SOFI monthly chart forms a bullish cup‑handle pattern, structure intact, short‑term sentiment is weak.
chad.
TA_Analyst
Trader
B
21.3K @chad_ventures Neutral
SOFI faces strong resistance at $19; a breakthrough would complete the bottoming.
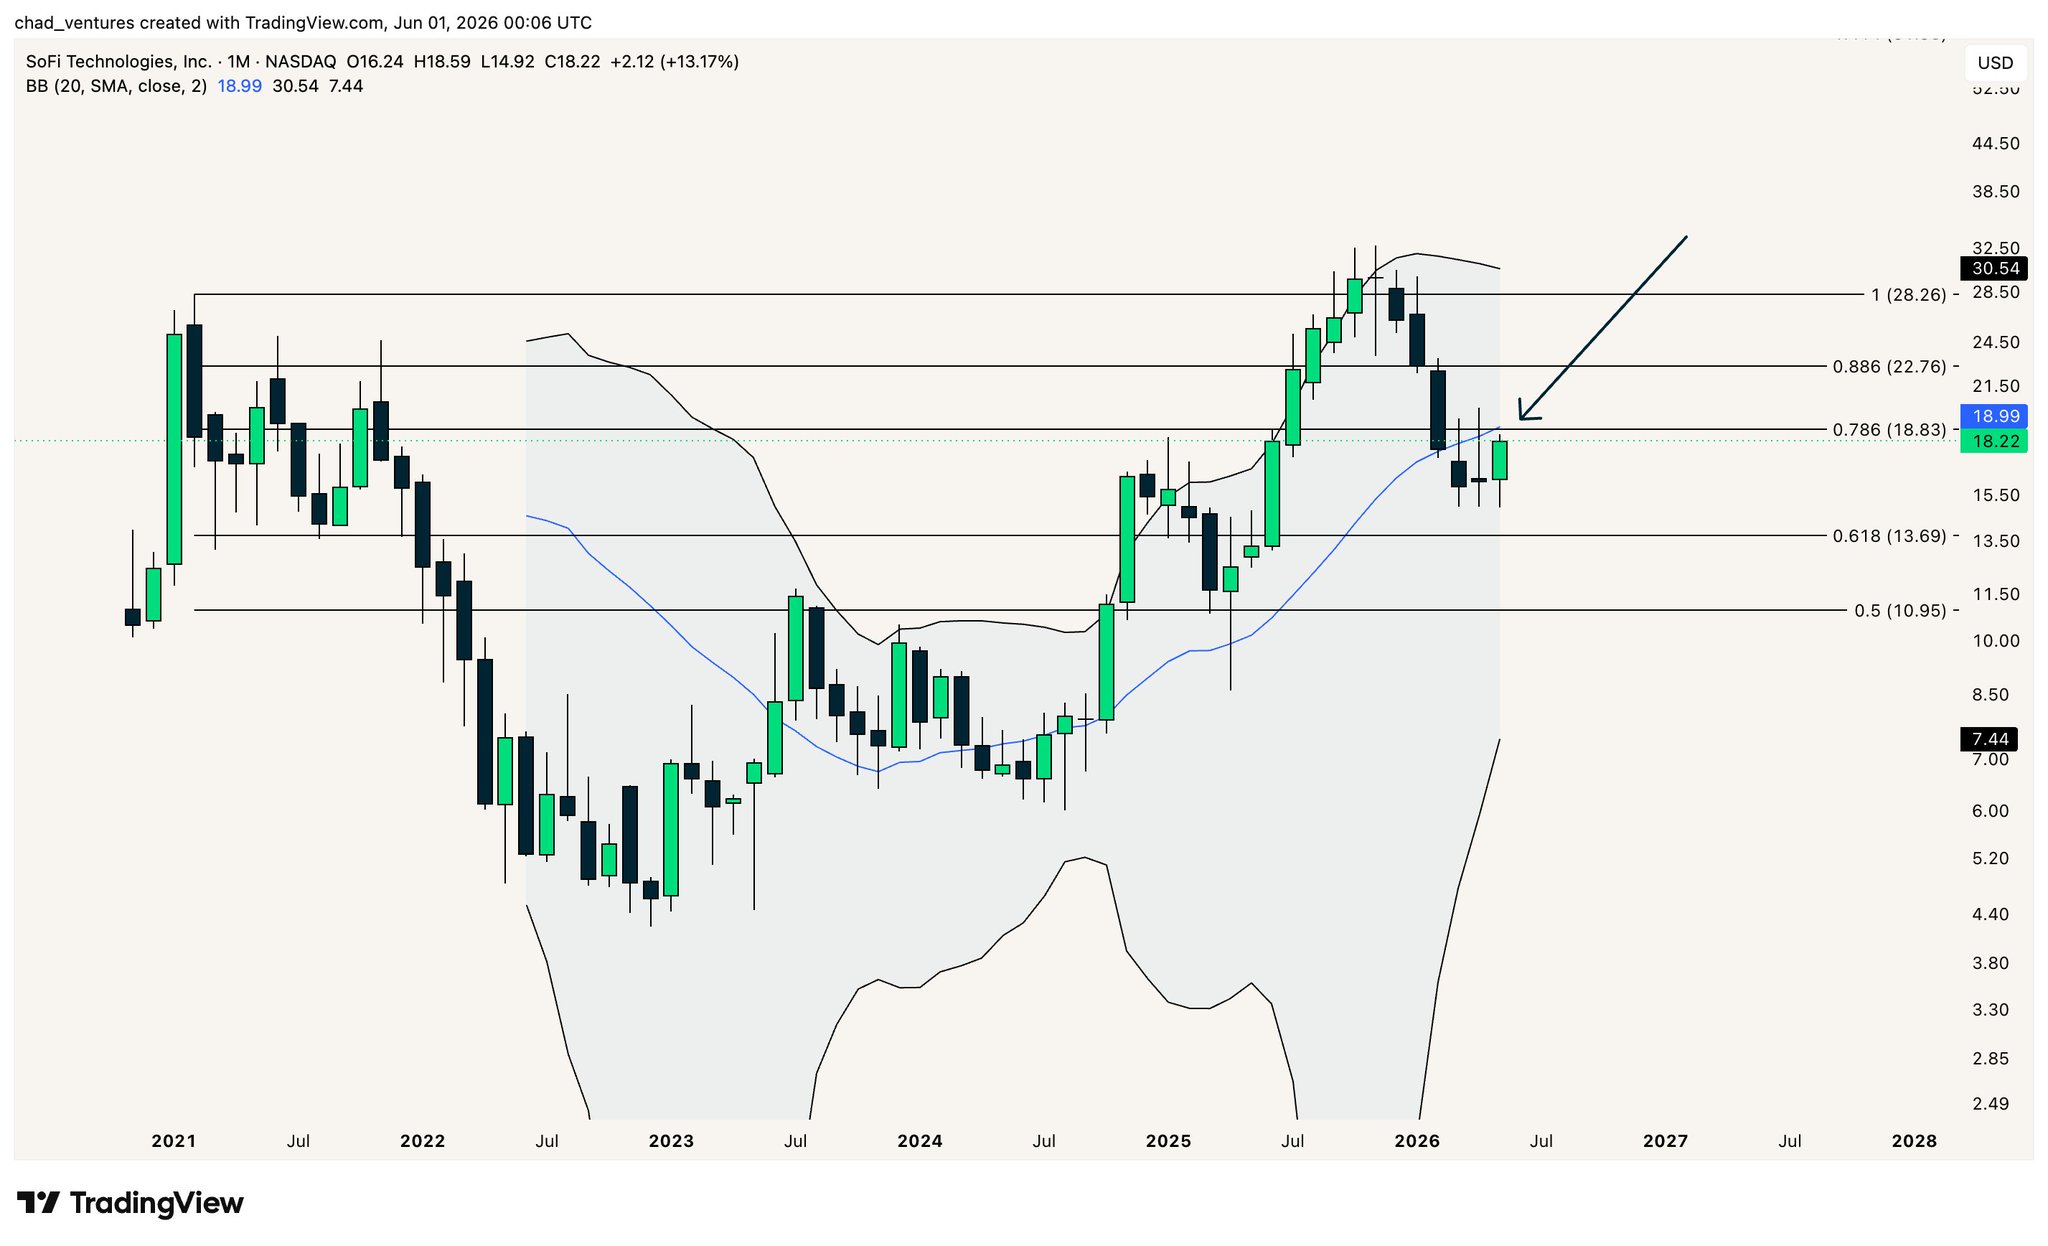
$SOFI is sitting at a strong resistance confluence from the 20-month SMA and 0.786 log Fibonacci level, both located around $19.
Essential to reclaim that area in order to confirm a higher low and wrap up the bottoming process. https://t.co/RoGiTJbjED
 42
3
3.6K
42
3
3.6K
2026-06-01 00:37
Trend of SOFI after release
Neutral
SOFI faces strong resistance at $19; a breakthrough would complete the bottoming.
Price Prediction
When is a good time to buy SOFI? Should I buy or sell SOFI now?
When deciding whether it’s a good time to buy or sell RAI Finance (SOFI), it’s important to first align with your own trading strategy and risk profile.Long-term investors and short-term traders often interpret market conditions differently, so your decision should reflect your personal approach. According to the latest SOFI 4-hour technical analysis, the current trading signal is Hold. According to the latest SOFI 1-day technical analysis, the current signal is Hold.

Beacon Prediction
Probabilistic Price Forecast (Next 24 Hours)Beacon Prediction Disclaimer
The data results displayed on this page are analyzed based on actual trading data (OHLCV) of the selected trading pair along with corresponding technical indicators.
This prediction is an experimental technical product and is provided for reference purposes only. It does not constitute investment advice. Unexpected real-world events may significantly impact market behavior. Traders should make decisions with caution.
This prediction is an experimental technical product and is provided for reference purposes only. It does not constitute investment advice. Unexpected real-world events may significantly impact market behavior. Traders should make decisions with caution.
About RAI Finance
RAI Finance (SOFI) is a cryptocurrency and operates on the Ethereum platform. RAI Finance has a current supply of 1,000,000,000 with 598,306,249.79 in circulation. The last known price of RAI Finance is 0.00004697 USD and is up 5.79 over the last 24 hours. It is currently trading on 21 active market(s) with $0.00 traded over the last 24 hours. More information can be found at https://rai.finance/.
Read More
Official Links
Chain Explorer
Explore More
BM Discovery


New Listing

ZTRA Zentra Privacy
-- 0.00%

ATEG ATEG.DV
-- 0.00%

GCOIN G COIN
-- 0.00%

ISK$ Iskander Coin
-- 0.00%

$BLAST SafeBLAST
-- 0.00%

SPYON SPDR S&P 500 Tokenized ETF (Ondo)
-- 0.00%

QQQON Invesco QQQ Tokenized ETF (Ondo)
-- 0.00%

MCDON McDonald's Tokenized Stock (Ondo)
-- 0.00%

MSTRON MicroStrategy Tokenized Stock (Ondo)
-- 0.00%

AVGOON Broadcom Tokenized Stock (Ondo)
-- 0.00%