Get Started
Scan to Download App
iOS & Android
BitMart / Crypto / MSTR

MSTR (MSTR)

$
$ 0.13 (MSTR/USD)
0.00%
24H

MSTR MSTR Price History USD

Track the price of MSTR for today, 7 days, 30 days and 90 days
Period
Change
Change (%)
Today
$ 0
0.00%
7days
$ 0.19
-58.82%
30days
$ 0.049
-26.32%
90days
$ 0.38
-73.58%

Own MSTR Now

Buy and sell MSTR easily and securely on BitMart.
Buy/Sell MSTR Now
Buy/Sell {0} Now
MSTR Market Information
Last price $ 0.13
$ 0.13 24h Range $ 0.13
All time high
‎$ 18.15‎
All time low
‎$ 0.000019‎
24h Change
‎0.00%‎
24h Vol
‎$ 0‎
Circulating supply
0.00 MSTR
Market cap
‎$ 0‎
Max supply
10.00B MSTR
Fully diluted market cap
‎$ 1.40B‎
Trade MSTR

Earn

Put your idle crypto to work and earn passive income through savings, staking, and more.
Try Now
Try Now

MSTR X Insight

avatar
MSTR is expected to continue falling, with a target price range of $95-$62, and a break below $104 will confirm the trend.

$MSTR

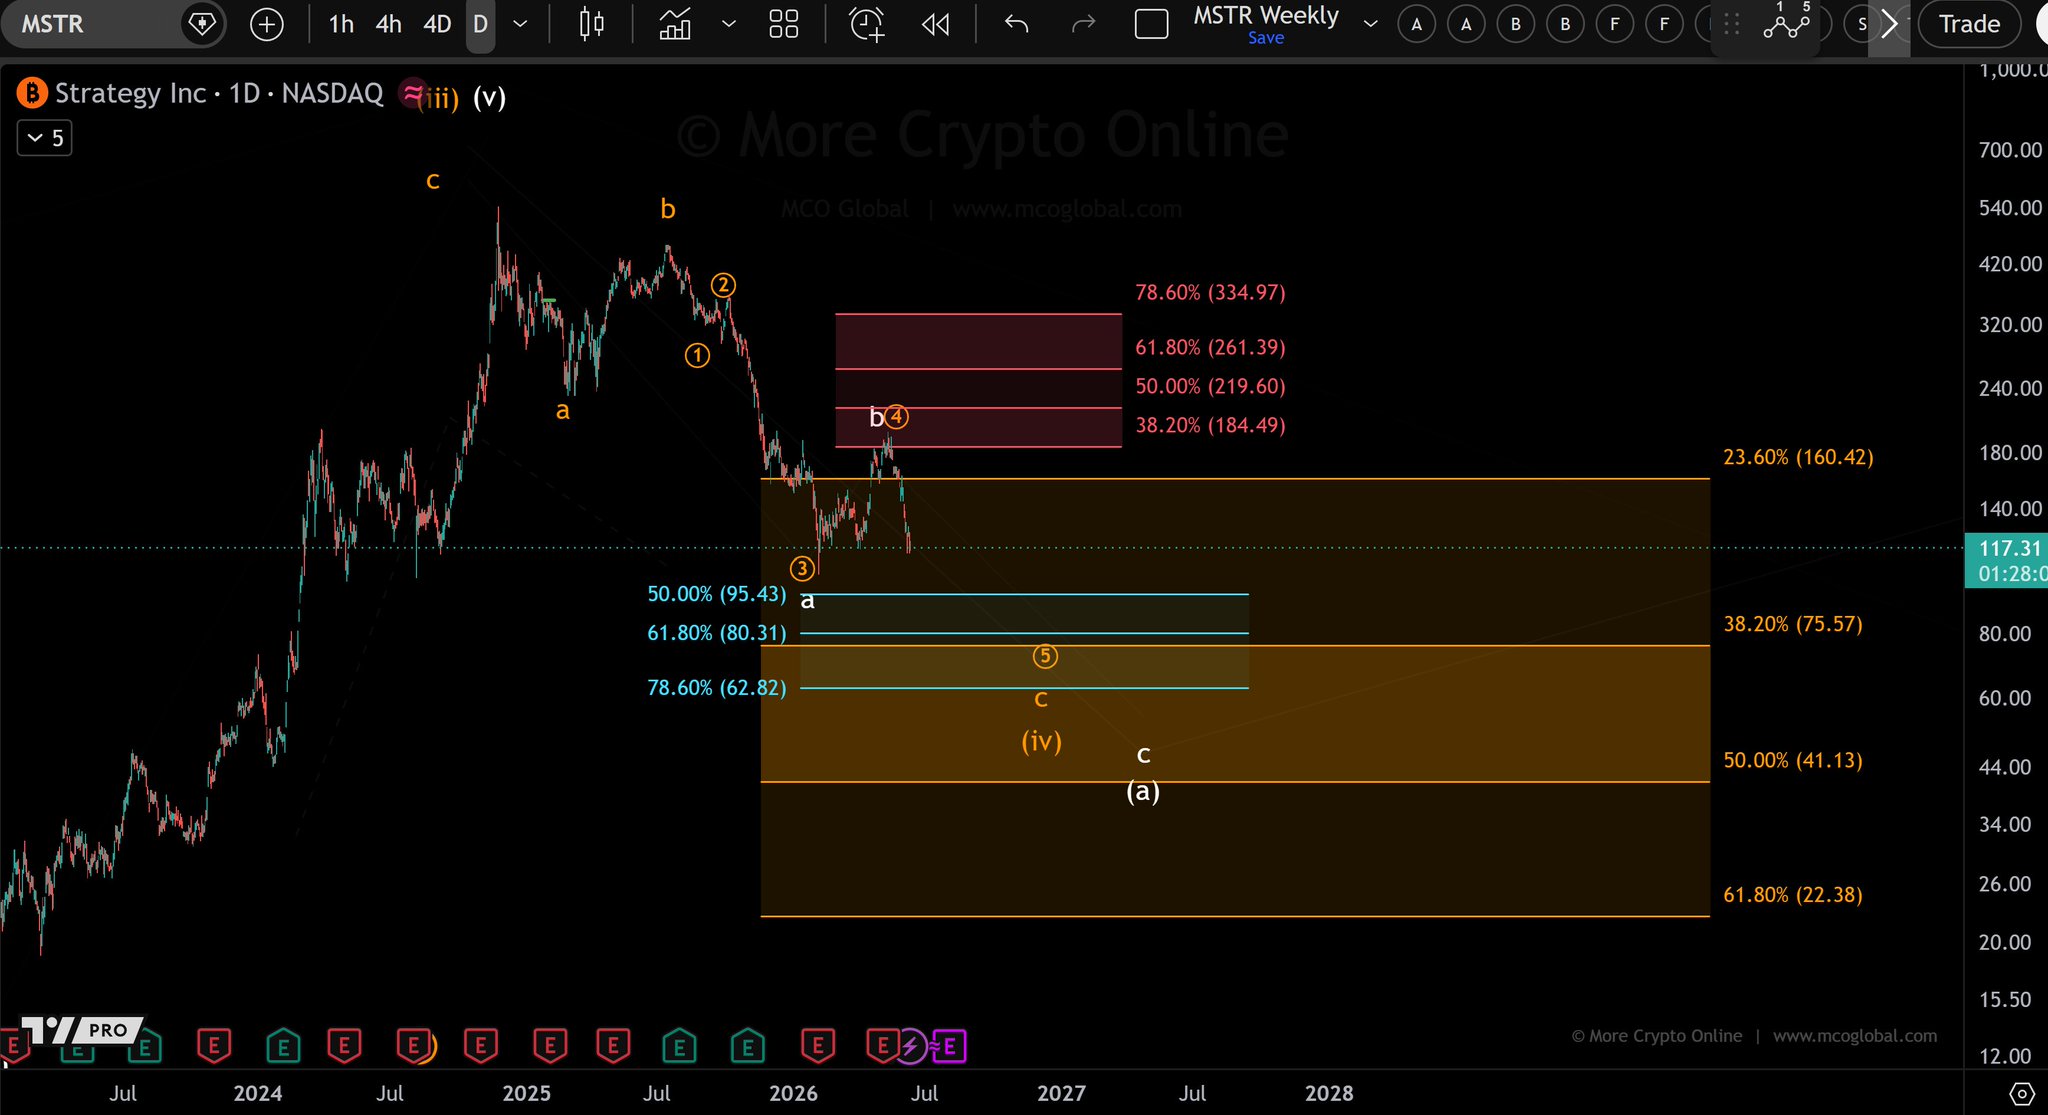
The higher timeframe outlook remains largely unchanged, but the structure is increasingly favoring the view that the recent high may have been a completed wave 4 rather than a larger B-wave. The market has already undergone a substantial correction and momentum indicators are approaching oversold territory on higher timeframes.

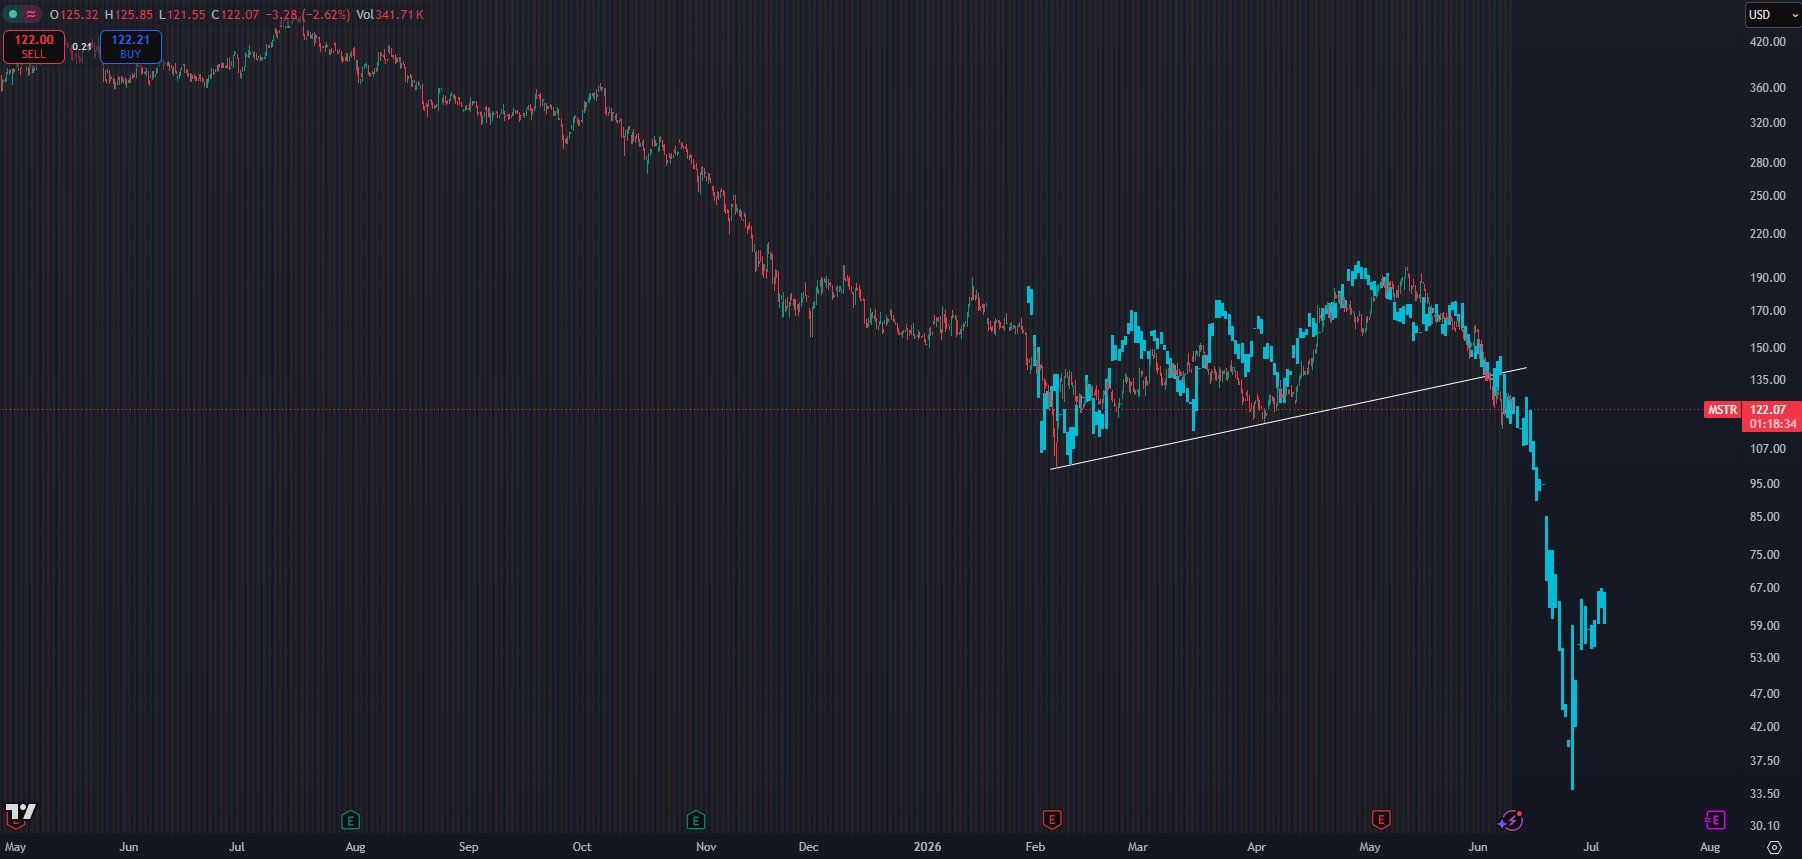
Leading Scenario: The preferred outlook is shifting toward the orange wave 4 interpretation. In this scenario, the correction is approaching its later stages and the next major downside target zone is located between $95 and $62. A break below $104 would provide further confirmation that the decline is continuing toward that support region.

Risk Scenario: The white count still allows for the possibility that the recent high was a larger B-wave, which could theoretically allow for another recovery attempt before the next major decline. However, this scenario is becoming less favored as the market continues to weaken and momentum readings move toward oversold conditions.

Key Support Levels: $104 / $95-$62

Key Resistance Levels: Recent May high

Bottom Line: MSTR continues to favor lower prices, with the probability increasing that the recent high marked a completed wave 4. A break below $104 would strengthen the case for a move into the $95-$62 support region, while the more bearish white count could eventually target even lower levels near $75 or, in an extreme scenario, $40.

view 19
view 1
view 1.6K
2026-06-10 18:37
Trend of MSTR after release
Extremely Bearish
MSTR is expected to continue falling, with a target price range of $95-$62, and a break below $104 will confirm the trend.
avatar
The tweet criticizes MicroStrategy for turning its BTC strategy into a Ponzi scheme, sustaining it through shareholder dilution and high-cost financing, and holds an extremely bearish stance on MSTR.
avatar

🔥@Strategy is indeed a Ponzi scheme, with the risk falling entirely on $MSTR shareholders

📌 The DAT model operates best when mNAV >1:
- When mNAV >1: Sell shares / issue preferred -> buy more BTC -> increase BTC per share.
- When mNAV <1: Shares are discounted relative to net assets -> need to buy back shares, or sell assets to protect shareholders.

At the point when $MSTR shares have mNAV near 1, $MSTR should sell BTC to buy back shares, but Say lỏ did the opposite.
Self-diluting ordinary shareholders while the shares are cheaper than NAV.

📌 Strategy is no longer a company that only holds BTC:
- Common stock of MSTR is at the bottom.
- Preferred stock is in the middle.
- Convertible debt, dividend obligation, ATM issuance are above.
-> Bitcoin is the core of all the above. Strategy has to pay very high dividends for the preferred shares, leading to higher cost of capital, so it is no longer cheap. Even if the model is to be maintained, Strategy is forced to accept a higher yield (i.e., higher interest cost) to raise new capital.

Just like that.

view 59
view 3
view 3.7K
2026-06-10 04:17
Trend of MSTR after release
Extremely Bearish
The tweet criticizes MicroStrategy for turning its BTC strategy into a Ponzi scheme, sustaining it through shareholder dilution and high-cost financing, and holds an extremely bearish stance on MSTR.
avatar
Recommend selling MSTR before it falls below $100, the chart shows a strong downtrend.
avatar

There's still time to sell your $MSTR above $100 https://t.co/eccNh233YX

view 324
view 72
view 105.6K
2026-06-10 02:37
Trend of MSTR after release
Bearish
Recommend selling MSTR before it falls below $100, the chart shows a strong downtrend.
Details

Price Prediction

When is a good time to buy MSTR? Should I buy or sell MSTR now?

When deciding whether it’s a good time to buy or sell MSTR (MSTR), it’s important to first align with your own trading strategy and risk profile.Long-term investors and short-term traders often interpret market conditions differently, so your decision should reflect your personal approach. According to the latest MSTR 4-hour technical analysis, the current trading signal is Hold. According to the latest MSTR 1-day technical analysis, the current signal is Hold.
48
Hold
4-hour technical analysis of MSTR
Last Update 2026-06-10 15:59:59
48
Hold
1-day technical analysis of MSTR
Last Update 2026-06-09 23:59:59
beacon

Beacon Prediction

Probabilistic Price Forecast (Next 24 Hours)
i
Beacon Prediction Disclaimer
The data results displayed on this page are analyzed based on actual trading data (OHLCV) of the selected trading pair along with corresponding technical indicators.
This prediction is an experimental technical product and is provided for reference purposes only. It does not constitute investment advice. Unexpected real-world events may significantly impact market behavior. Traders should make decisions with caution.
About MSTR
MSTR (MSTR) is a cryptocurrency launched in 2024and operates on the Base platform. MSTR has a current supply of 10,000,000,000 with 0 in circulation. The last known price of MSTR is 0.13732325 USD and is up 0.00 over the last 24 hours. It is currently trading on 2 active market(s) with $0.00 traded over the last 24 hours. More information can be found at https://mstr.sbs.
Read More