Fangen Sie an.
Zum Herunterladen scannen
iOS und Android
BitMart / Krypto / RENDER

Render (RENDER)

$
$ 1.27 (RENDER/USD)
1.60%
24H

Render Live Kursdaten

Der heutige Preis von Render ist $ 1.27 (RENDER/USD). Mit einer Marktkapitalisierung von $ 658.32M USD. 24-Stunden-Handelsvolumen von $ 28.31M USD, Eine 24-Stunden-Preisänderung von +1.60%, Sowie einer Umlaufmenge von 518.77M RENDER.

Render RENDER Preisverlauf USD

Verfolgen Sie den Preis von Render für heute, 7 Tage, 30 Tage und 90 Tage
Zeitraum
Ändern
Veränderung (%)
Heute
$ 0.019
1.60%
7Tage
--
--
30Tage
--
--
90Tage
--
--

Besitzen Sie RENDER jetzt

Kaufen und verkaufen Sie RENDER einfach und sicher auf BitMart.
Jetzt RENDER kaufen/verkaufen
Jetzt {0} kaufen/verkaufen
Render Marktinformationen
Letzter Preis $ 1.27
$ 1.23 24-Std.-Bereich $ 1.27
Allzeithoch
‎$ 0‎
Allzeittief
‎$ 0‎
24-Std.-Veränderung
‎1.60%‎
Menge 24 Std.
‎$ 28,306,770.30‎
Zirkulierendes Angebot
0.51B RENDER
Marktobergrenze
‎$ 658.32M‎
Nettomenge
0.64B RENDER
Vollständig verwässerte Marktobergrenze
‎$ 817.44M‎
Handel RENDER

Verdienen

Setzen Sie Ihre ungenutzten Kryptowährungen ein und erzielen Sie passives Einkommen durch Ersparnisse, Staking und mehr.
Jetzt versuchen
Jetzt versuchen

Render X Insight

avatar
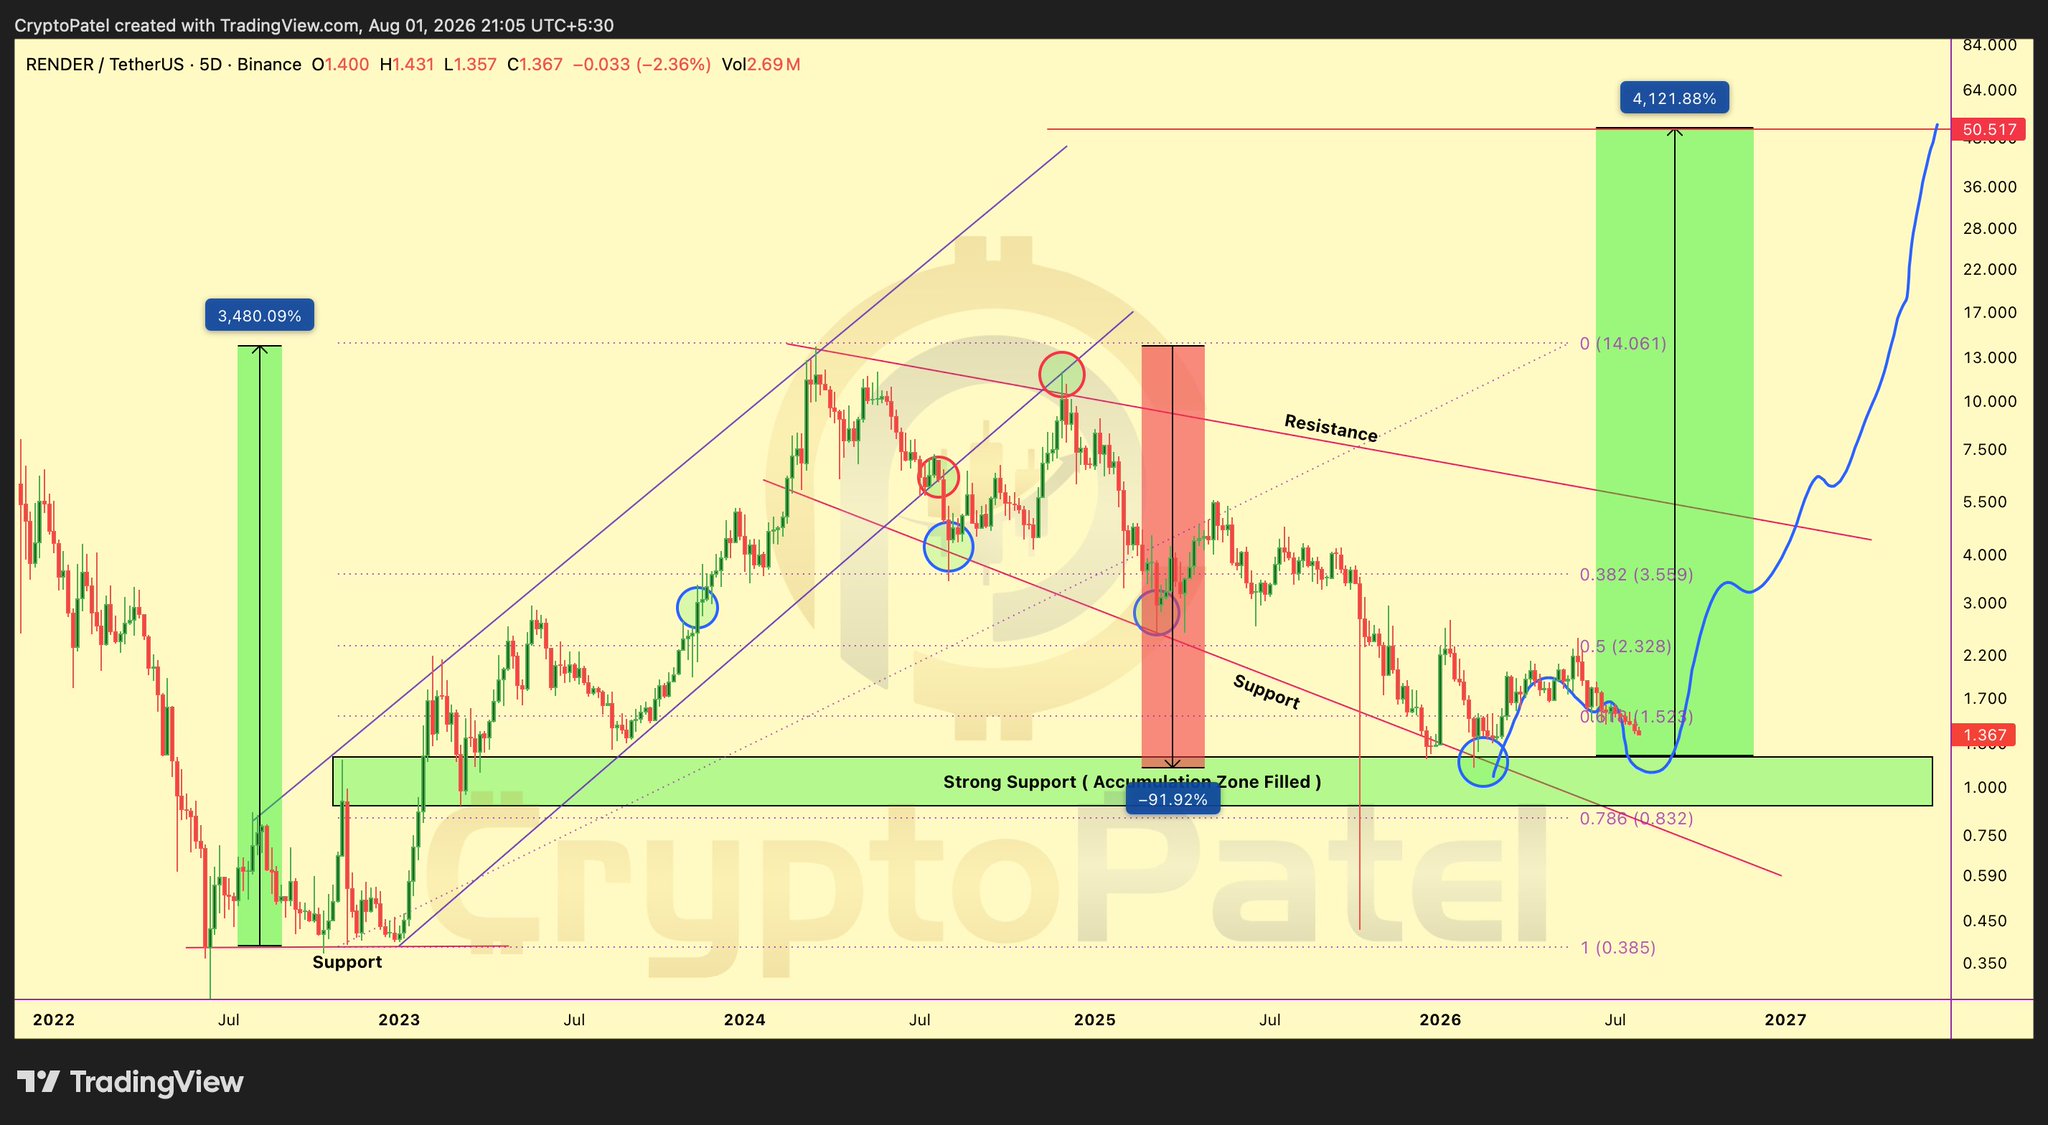
RENDER is in an accumulation zone, with limited downside and huge upside potential, target price $10-$50.

$RENDER is back in the same HTF Accumulation zone that fueled its previous parabolic rally

After a 92%+ correction, downside looks increasingly limited while the upside remains massive. If this support holds, the next major move could catch most people completely off guard. 🚀

Accumulation Zone: $1.35-$0.90
Targets: $10 | $20 | $30 | $50
Stop Loss: HTF Close Below $0.70

NFA & Always DYOR

@render
view 282
view 23
view 31.2K
2026-08-02 05:37
Trend von RENDER nach Veröffentlichung
Extrem bullisch
RENDER is in an accumulation zone, with limited downside and huge upside potential, target price $10-$50.
avatar
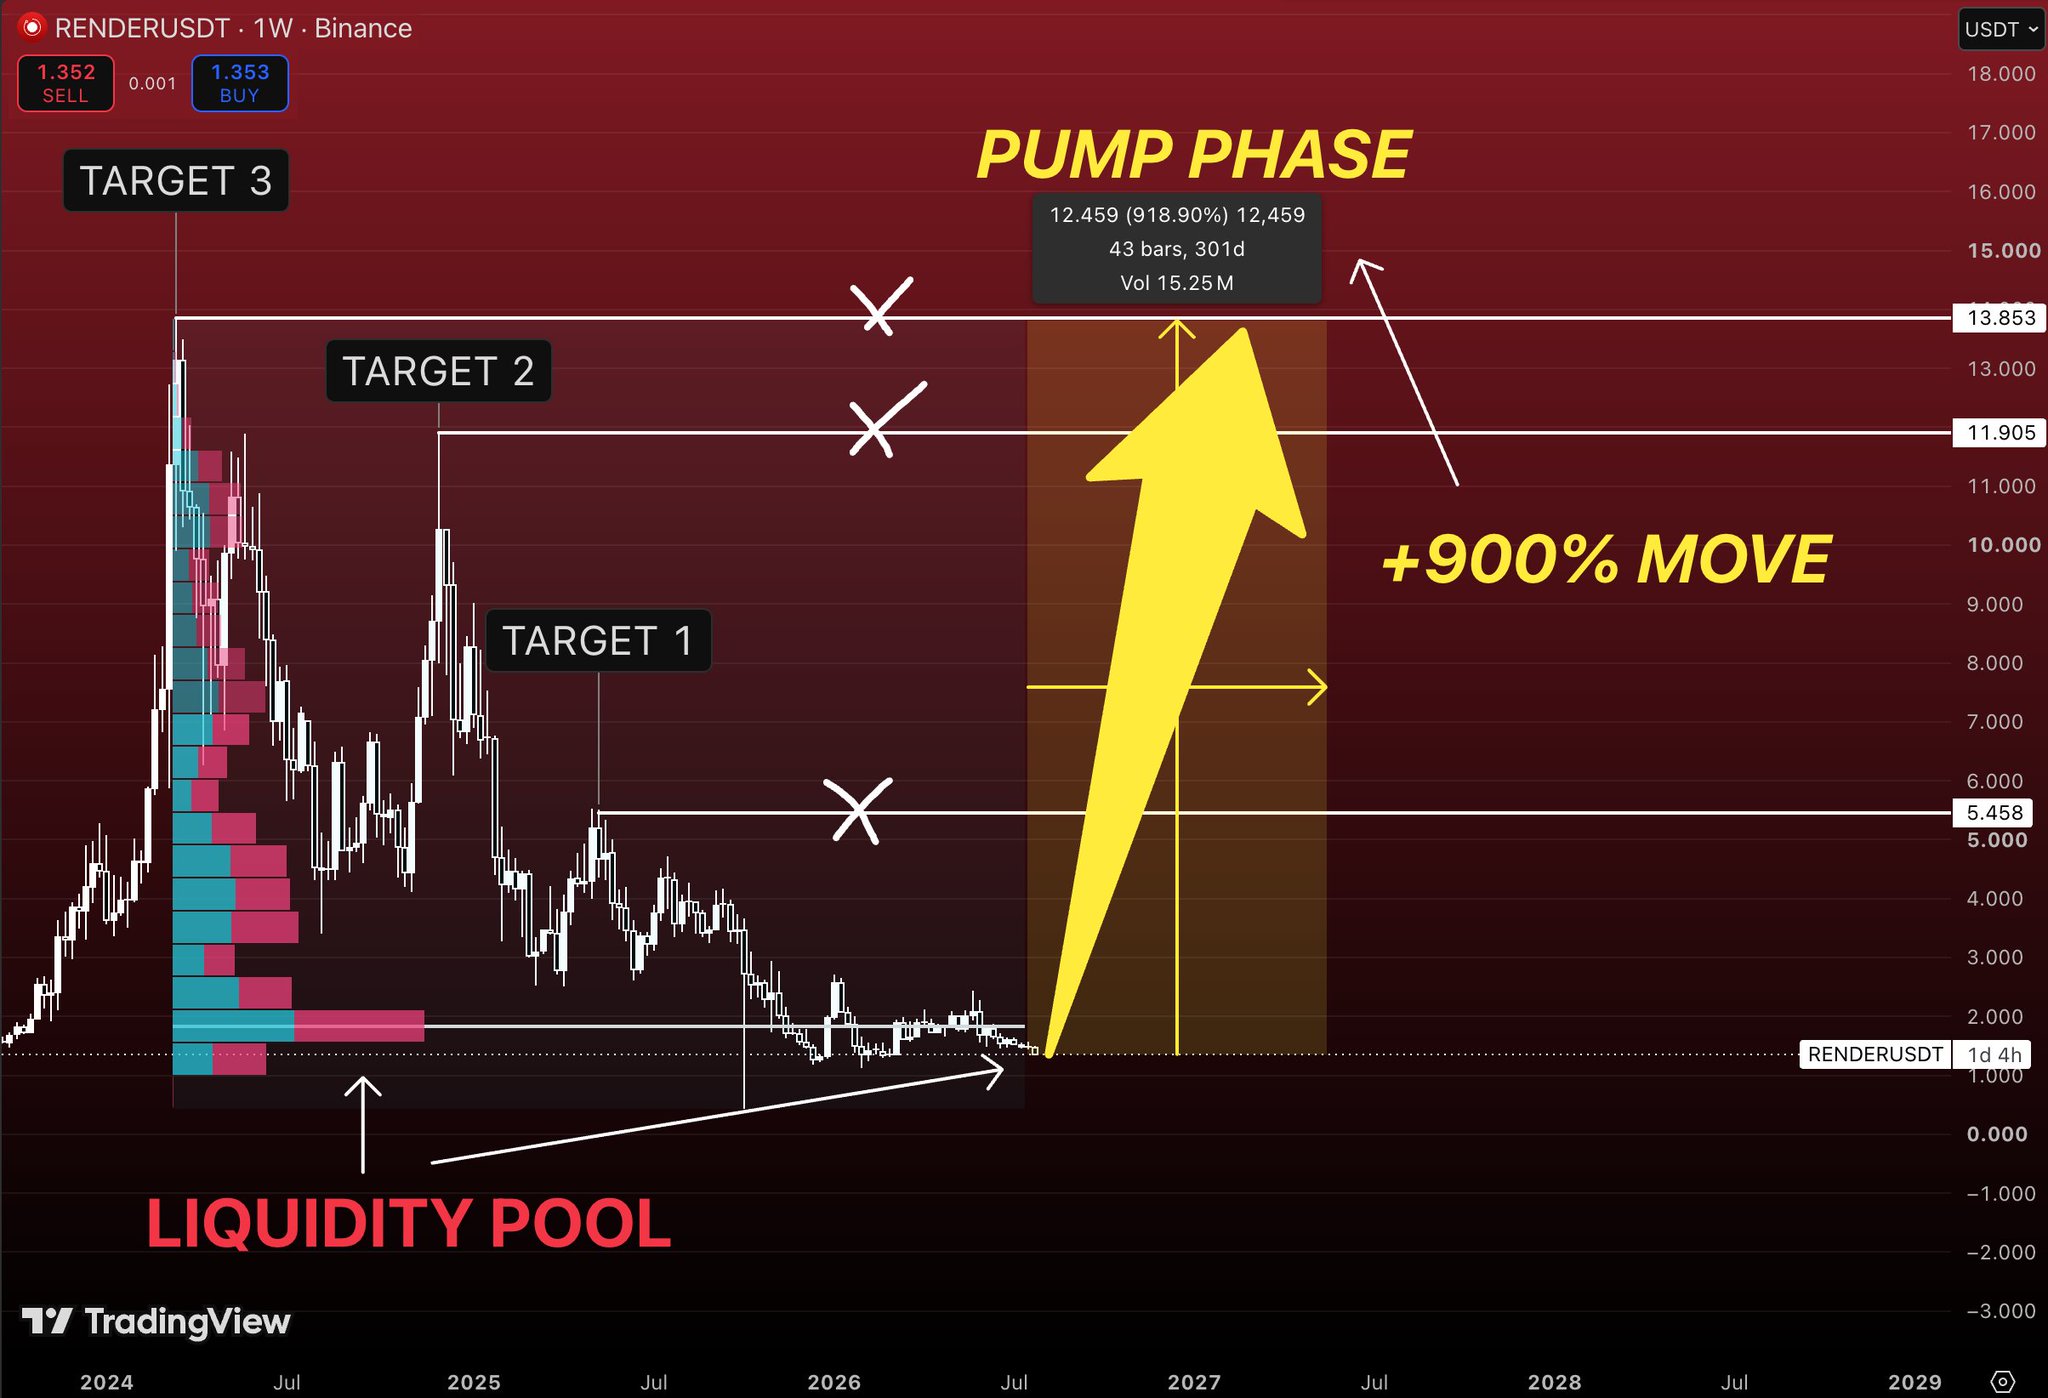
RENDER has completed its bottoming phase, expected to see a 900% rise, target price $13.8.

$RENDER has spent more than a year doing one thing.\n\nBuilding a base while everyone was chasing other narratives.\n\nMost traders see a chart that’s gone nowhere.\n\nLong-term investors see something completely different.\n\nA market that has already gone through its correction and has spent months transferring coins from impatient hands to patient ones.\n\nThat’s usually how the strongest trends begin.\n\nNot with excitement.\n\nWith boredom.\n\nOne thing immediately stands out on this chart.\n\nThe largest volume profile sits almost exactly where price is trading today.\n\nThat tells us this isn’t random consolidation.\n\nThis is where the majority of long-term positions have been built.\n\nAs long as that liquidity zone continues to hold, the bullish structure remains intact.\n\nThe first real objective sits around $5.45.\n\nIt’s the first major resistance where the previous cycle left behind significant supply.\n\nA breakout above that level would confirm that buyers have regained control of the larger trend.\n\nAbove it, the next destination becomes $11.9.\n\nThat’s where market psychology begins to shift.\n\nInvestors who ignored the move suddenly start paying attention, while those who sold near the lows begin chasing higher prices.\n\nMomentum usually accelerates once that process starts.\n\nThe final target sits near $13.8, close to the previous cycle highs.\n\nIf $RENDER manages to reclaim that area, the market enters price discovery once again.\n\nThat’s where trends often become much stronger than most people initially expect.\n\nThe interesting part isn’t the projected 900% move.\n\nIt’s the amount of time the market has spent preparing for it.\n\nBig trends rarely start after vertical rallies.\n\nThey usually start after months of silence.\n\nAfter everyone loses interest.\n\nAfter volatility disappears.\n\nThat’s exactly what this chart has been doing.\n\nIf AI narratives continue attracting capital during the next cycle\n\n$RENDER is already sitting in the kind of structure that has historically produced some of the strongest recoveries.\n\nThe hardest part isn’t buying these charts.\n\nIt’s believing in them while almost nobody else does.

view 17
view 0
view 799
2026-08-01 20:37
Trend von RENDER nach Veröffentlichung
Extrem bullisch
RENDER has completed its bottoming phase, expected to see a 900% rise, target price $13.8.
avatar
RNDR在关键支撑位1.20美元附近盘整,作者认为当前是理想入场点,未来有望上涨。

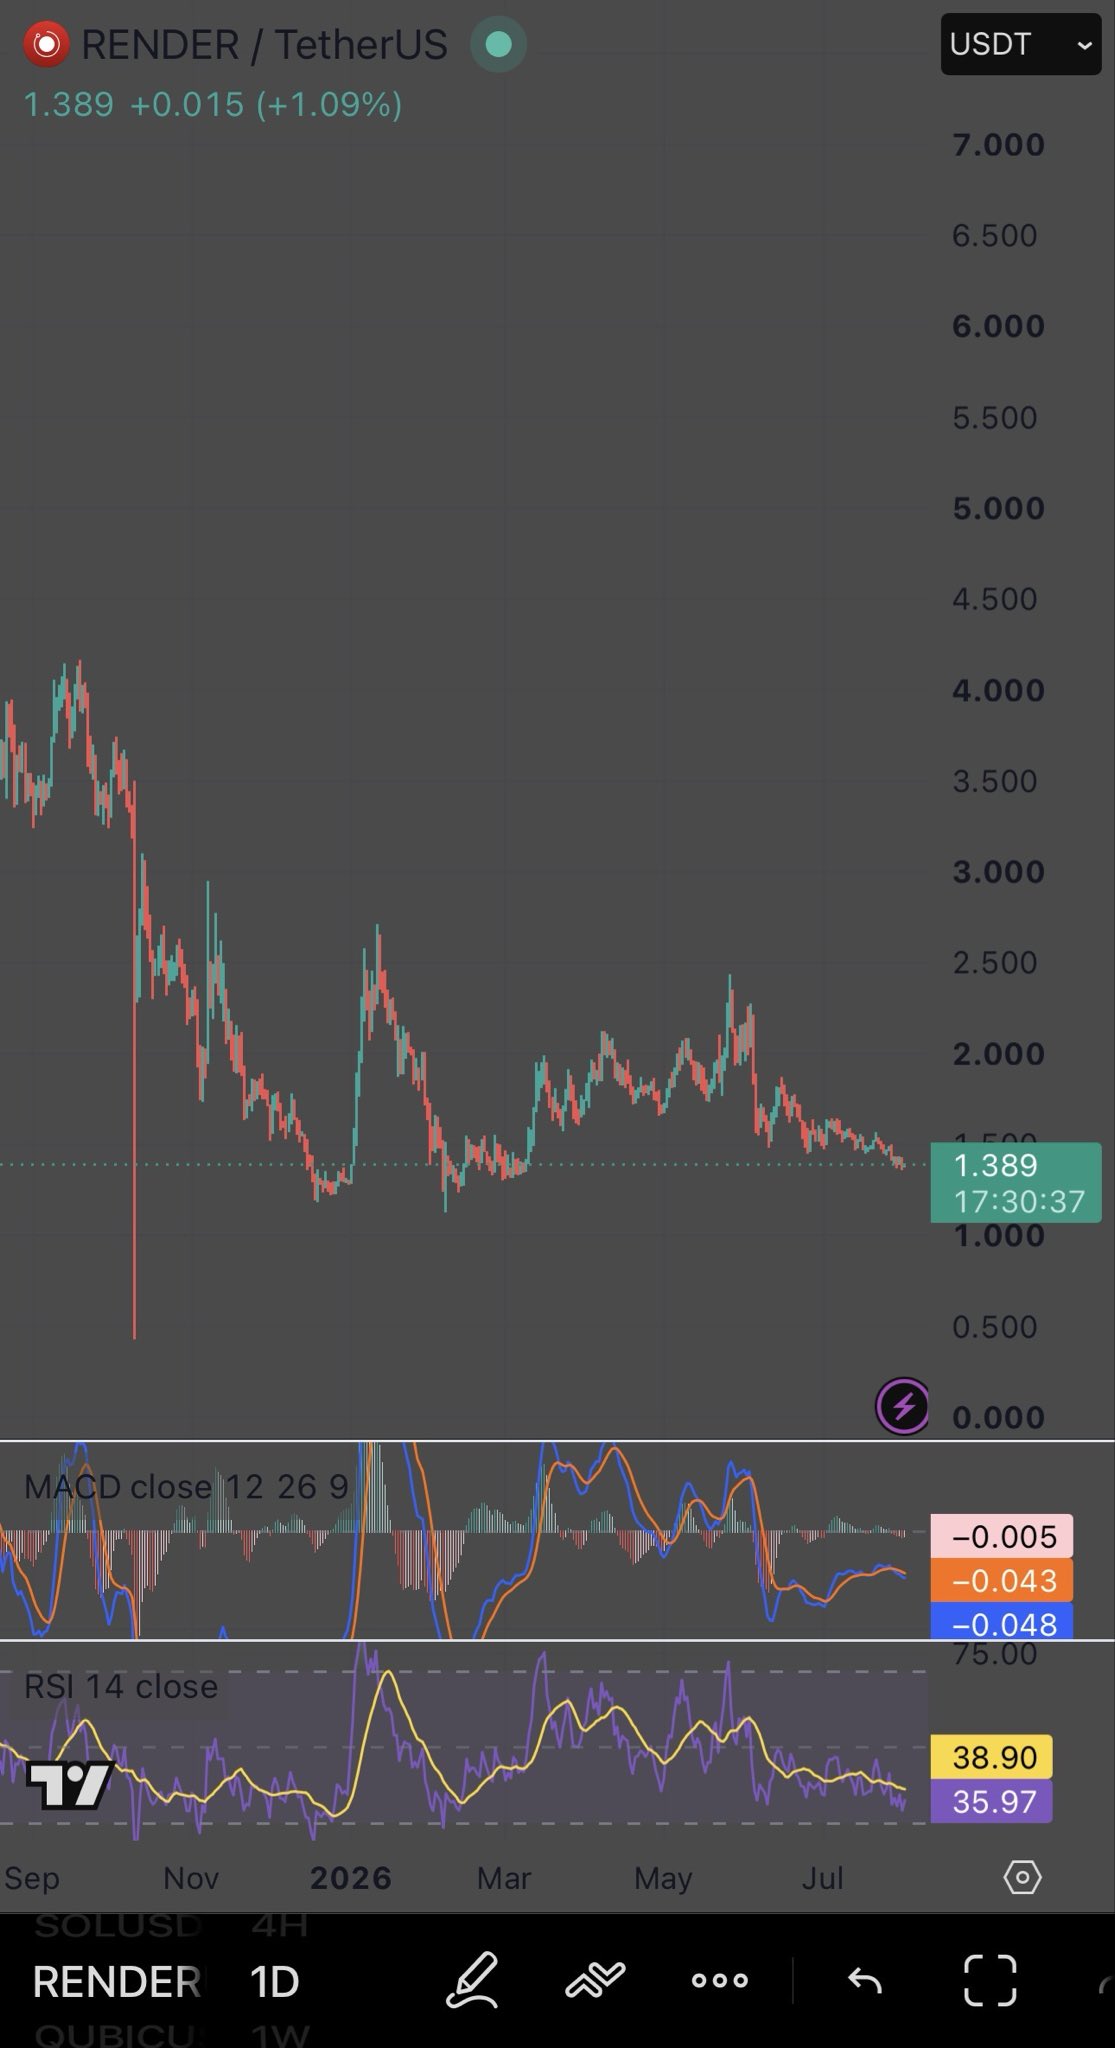
solana:rndrizKT3MK1iimdxRdWabcF7Zg7AR5T4nud4EkHBof fell 67% from its cycle high and the crowd stopped caring.

That is exactly when the chart starts telling the truth.

Price is back at 1.389, sitting on the same floor it defended all through last winter.

One number decides the next move:

1.20

Hold that base and this is a coiled decentralized GPU network with real rendering and AI compute demand behind it.

Lose it and the next honest support sits far below at 1.00.

Momentum is not screaming reversal yet.

RSI near 36 is weak but not oversold, and MACD is trying to curl without confirming.

That is a market catching its breath, not one turning.

Here is the part most people miss.

The best entries never feel safe.

They feel exactly like this, quiet and heavy and boring, while everyone waits for a green candle to hand them permission.

The people who mark 1.20 tonight will not need permission tomorrow.

Save this before it moves.

view 81
view 17
view 4.1K
2026-08-01 06:47
Trend von RENDER nach Veröffentlichung
Bullisch
RNDR在关键支撑位1.20美元附近盘整,作者认为当前是理想入场点,未来有望上涨。
Einzelheiten

Preisprognose

Wann ist ein guter Zeitpunkt, um RENDER zu kaufen? Soll ich RENDER jetzt kaufen oder verkaufen?

Bei der Entscheidung, ob es ein guter Zeitpunkt ist, Render (RENDER) zu kaufen oder zu verkaufen, ist es wichtig, sich zunächst an der eigenen Handelsstrategie und Ihrem Risikoprofil zu orientieren. Langfristig orientierte Anleger und kurzfristig orientierte Trader interpretieren Marktbedingungen oft unterschiedlich, daher sollte Ihre Entscheidung Ihre persönliche Herangehensweise widerspiegeln. Laut der neuesten vierstündigen technischen Analyse von RENDER lautet das aktuelle Handelssignal Halten.
52
Halten
4-stündige technische Analyse von RENDER
Letzte Aktualisierung 2026-08-11 23:59:59
beacon

Beacon Vorhersage

Probabilistische Preisprognose (nächste 24 Stunden)
i
Haftungsausschluss für Beacon-Vorhersagen
Die auf dieser Seite angezeigten Datenergebnisse werden basierend auf tatsächlichen Handelsdaten (OHLCV) des ausgewählten Handelspaares und den entsprechenden technischen Indikatoren analysiert.
Diese Prognose ist ein experimentelles technisches Produkt und wird lediglich zu Informationszwecken angegeben. Dies stellt keine Anlageberatung dar. Unerwartete Ereignisse in der realen Welt können erhebliche Auswirkungen auf das Marktverhalten haben. Händler sollten Entscheidungen mit Vorsicht treffen.
Über Render
Render (RENDER) is a cryptocurrency launched in 2019and operates on the Ethereum platform. Render has a current supply of 533,532,274.56269149 with 518,772,101.28269149 in circulation. The last known price of Render is 1.29691625 USD and is down -2.28 over the last 24 hours. It is currently trading on 656 active market(s) with $13,949,045.61 traded over the last 24 hours. More information can be found at https://rendernetwork.com/.
Mehr lesen
Kaufen RENDER
Handel RENDER