 Raydium (RAY)
$0.7058 -0.63% 24H
- 68مؤشر المعنويات الاجتماعية (SSI)+13.28% (24h)
- #24ترتيب اتجاه السوق (MPR)+72
- 4الانتشار الاجتماعي 24 سا+100.00% (24h)
- 100%نسبة KOL الصاعدة خلال 24 ساعة2 مؤثر KOL نشط
- ملخص
- إشارات صعود
- إشارات هبوط
مؤشر المعنويات الاجتماعية (SSI)
- البيانات الإجمالية68SSI
- اتجاه SSI (7ي)السعر (7 أيام)توزيع المشاعرمتصاعد بقوة (50%)صاعد (50%)رؤى SSI
ترتيب اتجاه السوق (MPR)
- منبه الرؤى
منشورات X
- اتجاه RAY بعد الإصدارصاعد
- اتجاه RAY بعد الإصدارصاعد
- اتجاه RAY بعد الإصدارمتصاعد بقوة
- اتجاه RAY بعد الإصدارمتصاعد بقوة
- اتجاه RAY بعد الإصدارمتصاعد بقوة
- اتجاه RAY بعد الإصدارهابط
- اتجاه RAY بعد الإصدارهابط
- اتجاه RAY بعد الإصدارمحايد
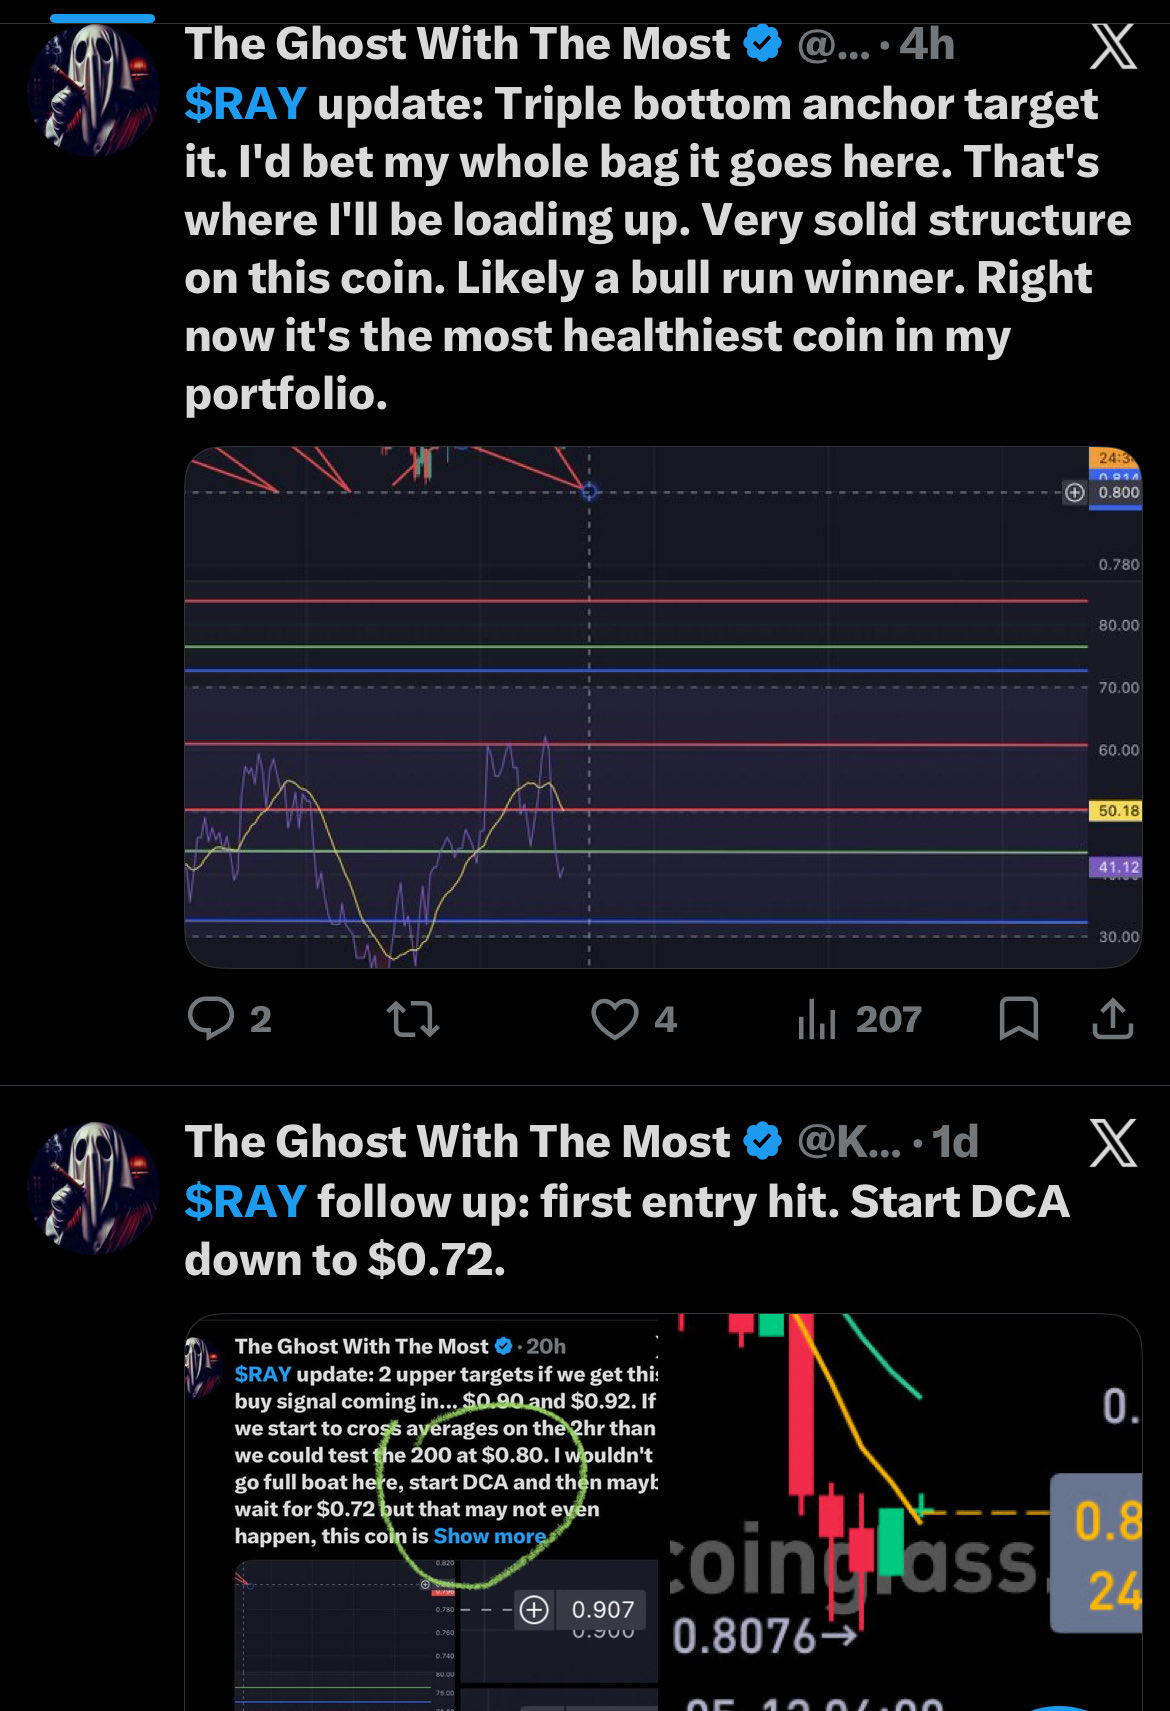
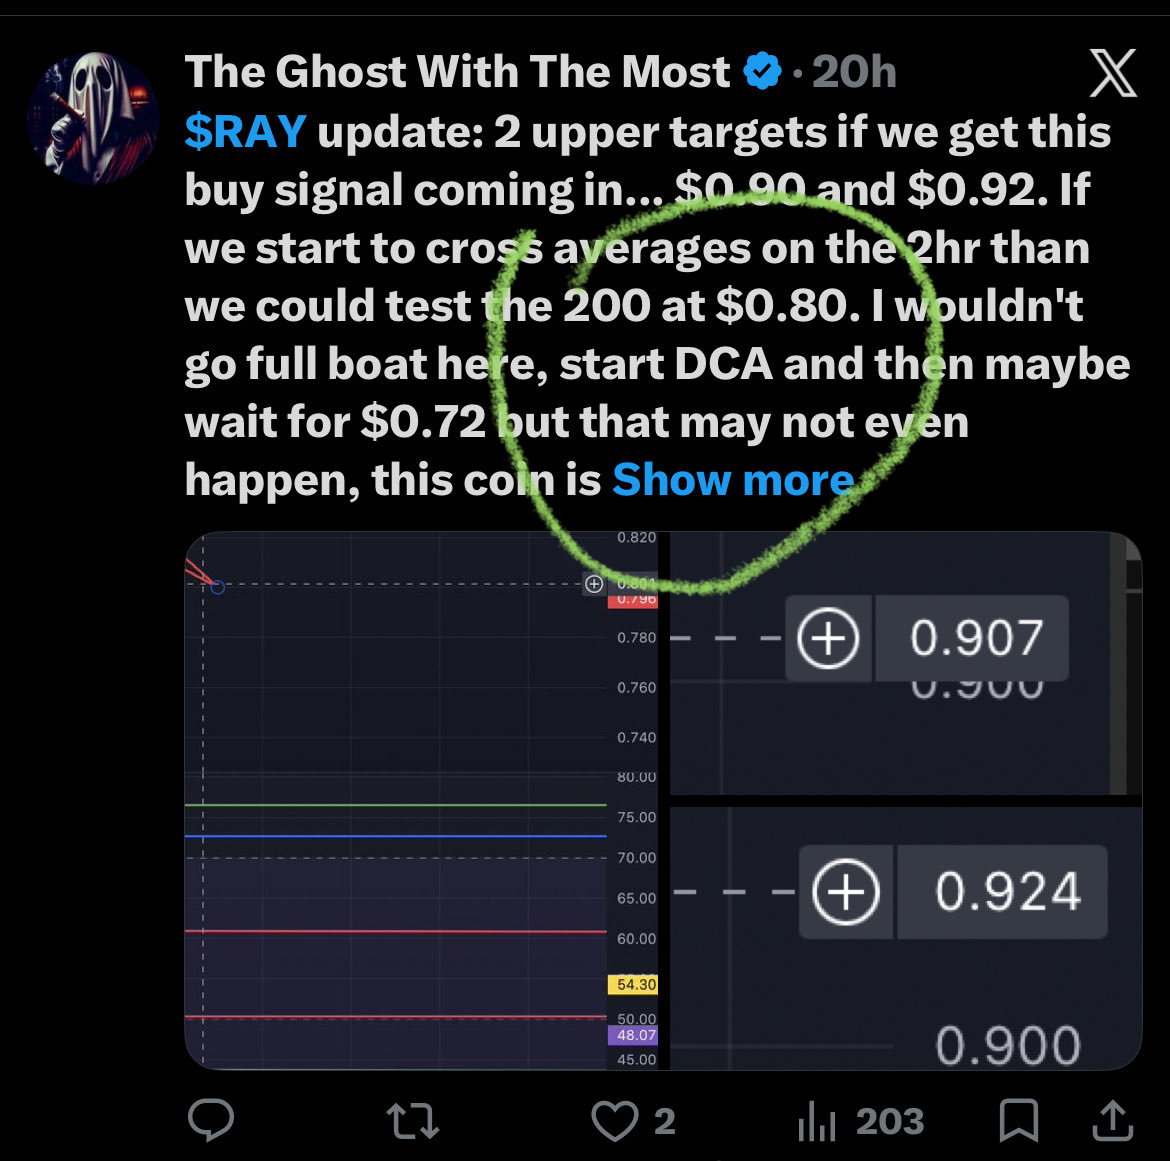
 The Ghost With The Most TA_Analyst Trader C3.19K @KubrickShining
 The Ghost With The Most TA_Analyst Trader C3.19K @KubrickShining
 The Ghost With The Most TA_Analyst Trader C3.19K @KubrickShining
 The Ghost With The Most TA_Analyst Trader C3.19K @KubrickShining
 8 5 493 أصلي >اتجاه RAY بعد الإصدارصاعد
 Nology TA_Analyst Trader A8.80K @nology3000
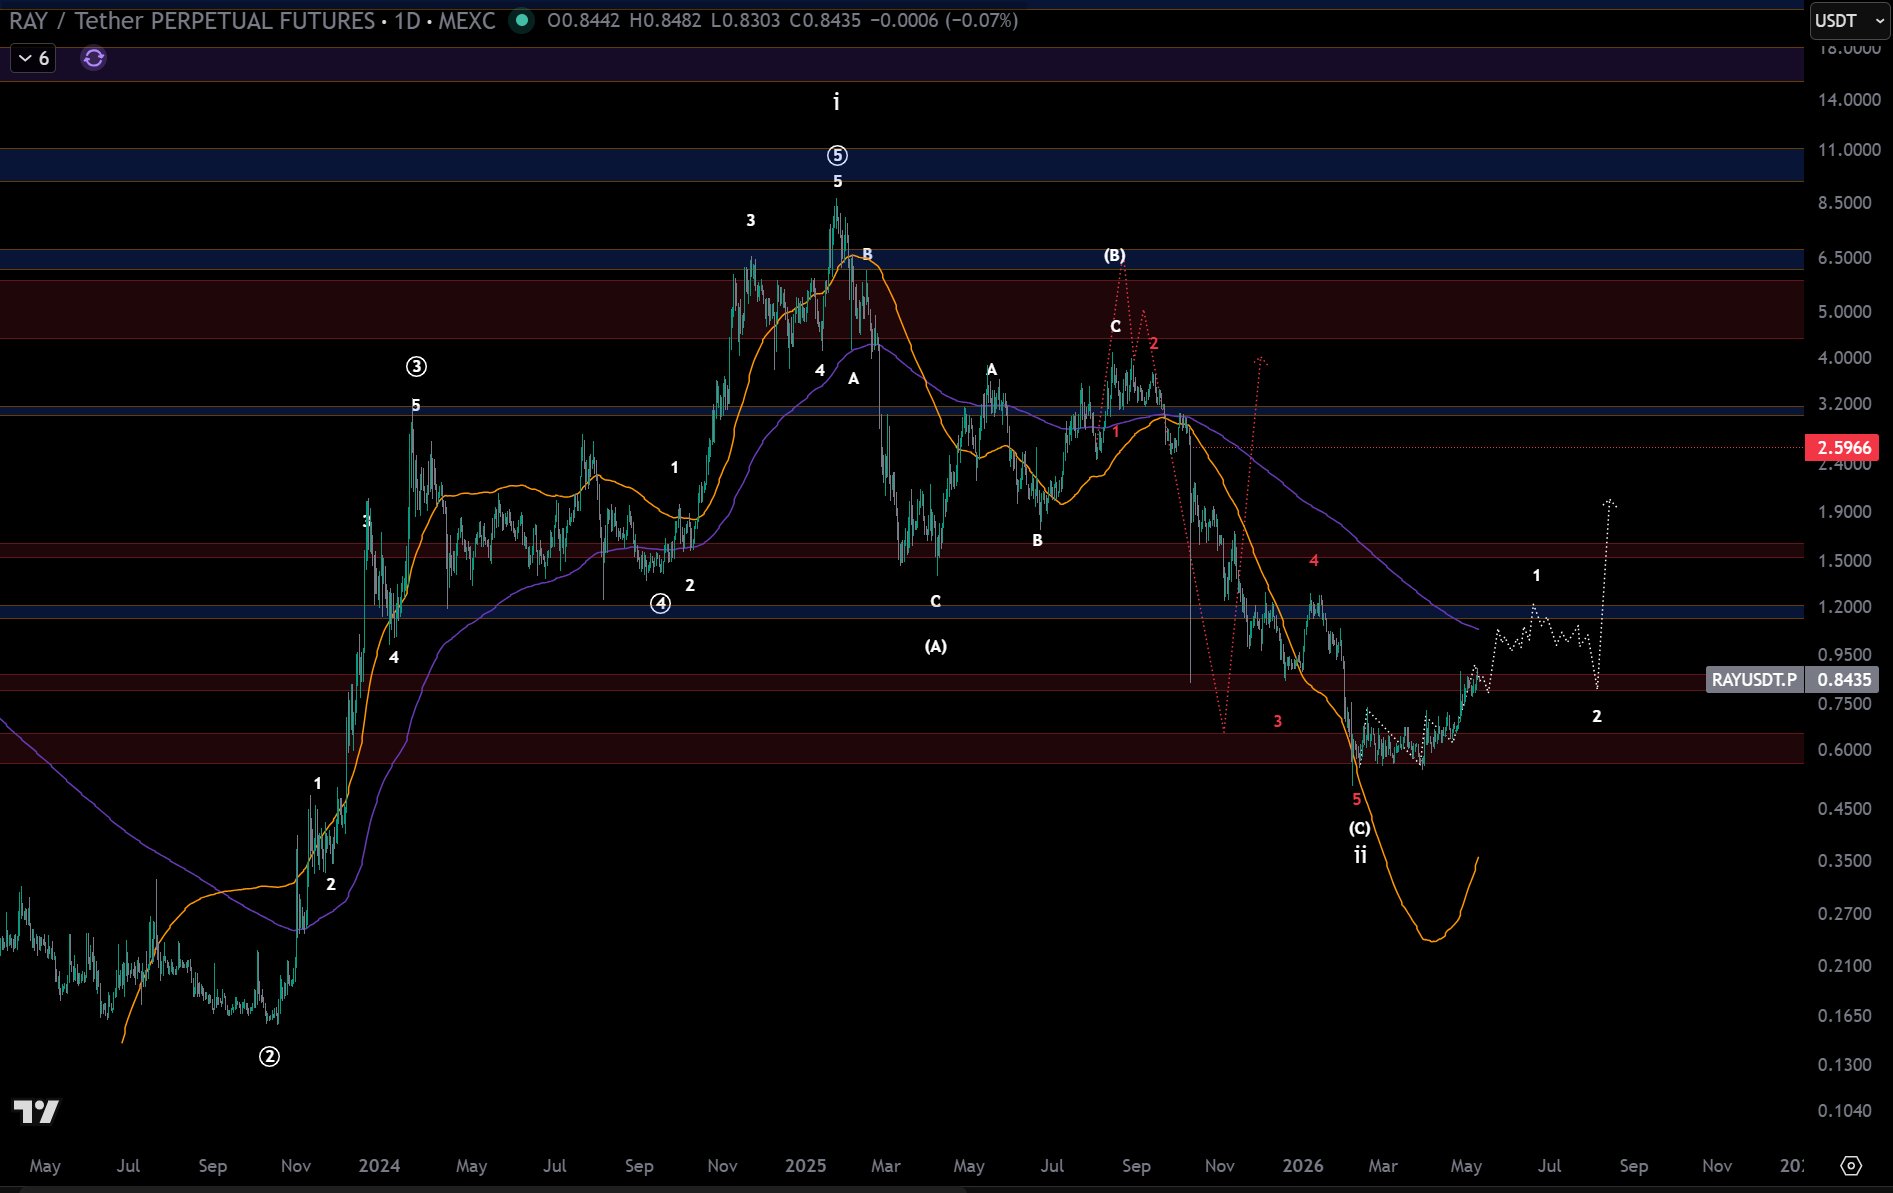 Nology TA_Analyst Trader A8.80K @nology3000
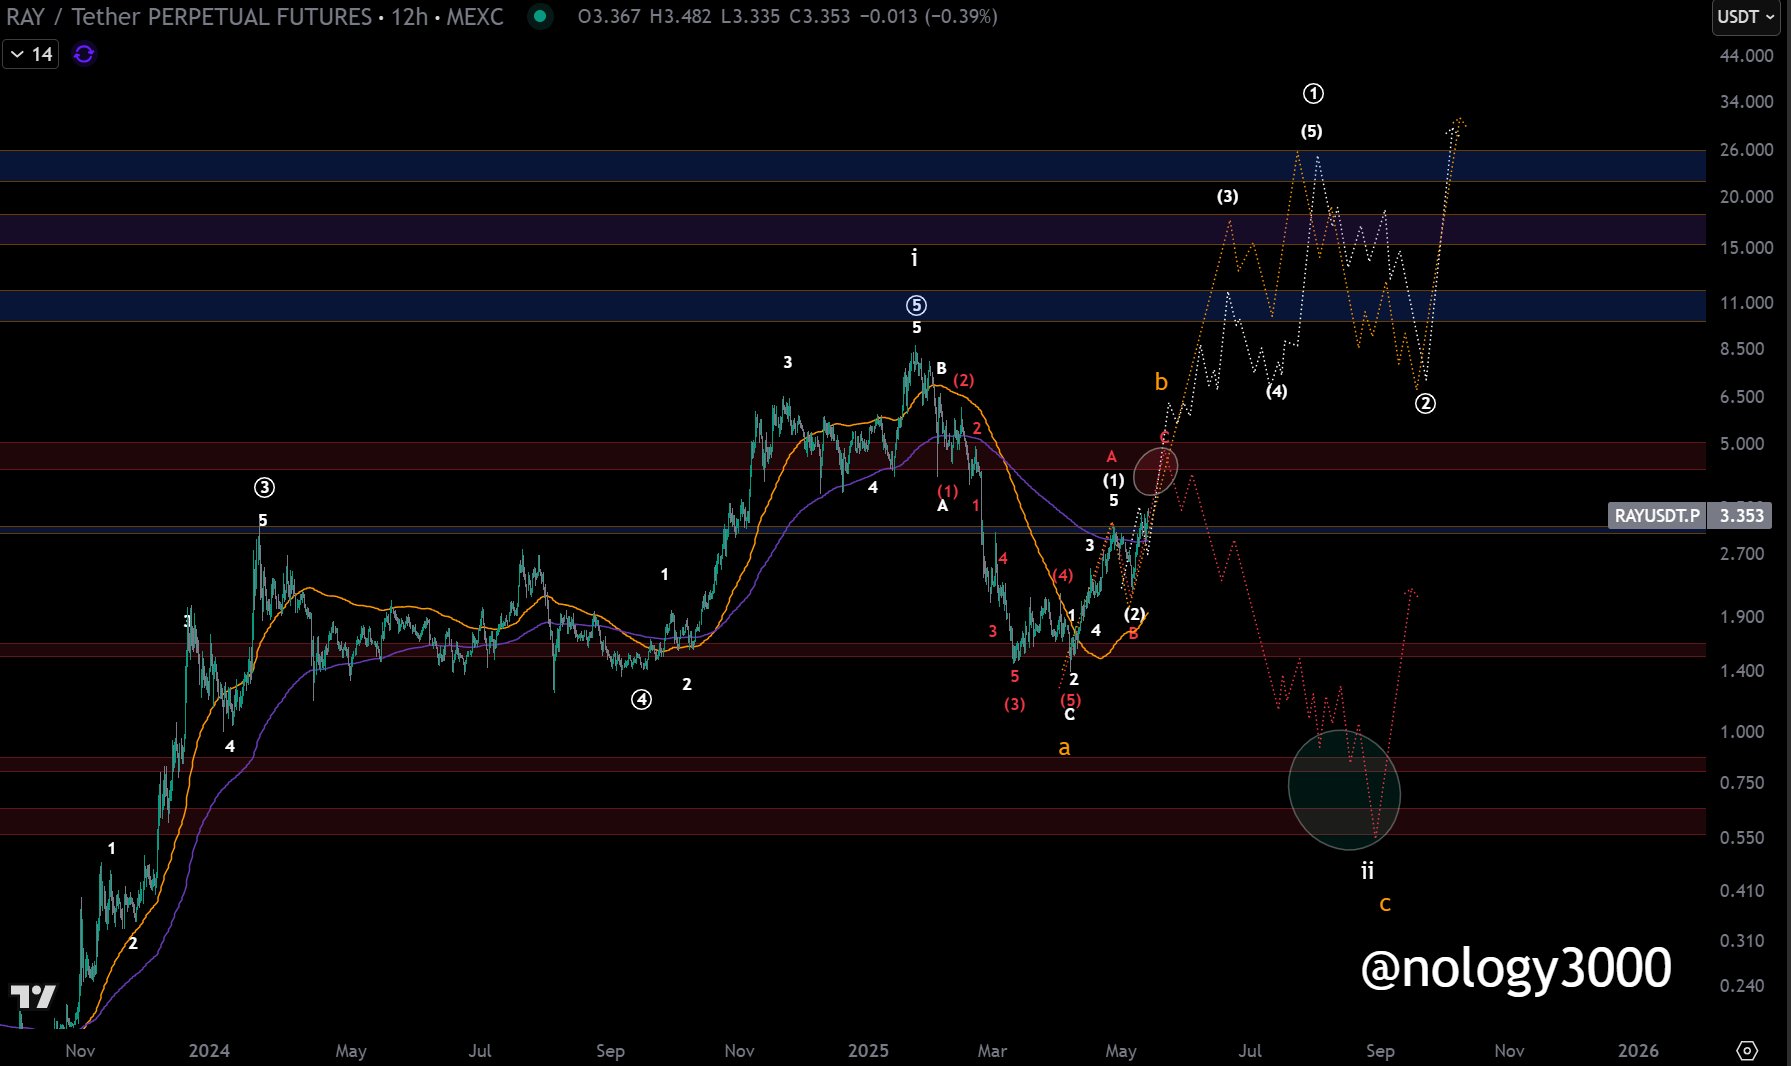 13 1 2.38K أصلي >اتجاه RAY بعد الإصدارمحايد